Programming languages are great for collaboration and reproducible research
Comments
COMMENT AS MUCH AS POSSIBLE!
# This is a comment in R it will be only for the userThis is not a comment and will cause an error
What is the difference between line 1 and 2?
YES! the # character will make everything after it a comment in that line of code
10+10# Everything after will be a comment7+4
Operators
Operators are characters with a specific function in R for example
3+3# this is a sum operator
[1] 6
3-2# this is a subtract operator
[1] 1
4*4# This is a multiplication
[1] 16
Later we will see other kind of operators, but… DONT STRESS about learning everything.
Objects
Objects in R are containers for information, we can create objects with any names we want that start with a letter
myNumber <-4myResult <-4*5
Storing multiple elements
Using the c() function
x <-c(1, 3, 5) # using the c() functionx
[1] 1 3 5
Using the list() function
y <-list(1, 3, 5) # using the list() functiony
[[1]]
[1] 1

[[2]]
[1] 3

[[3]]
[1] 5
Boolean logic
1==1# is it equal?
[1] TRUE
1!=1# is it NOT equal?
[1] FALSE
1%in%c(1, 2, 3) # is the number contained in the sequence?
[1] TRUE
Notice that we are using operators to make the comparisons
Functions
Functions are a special kind of object. Functions are objects that require arguments, the arguments needs to be inside parentheses.
# create a sequence of numbersseq(from =0, # Starting numberto =80, # Ending numberby =20# number increment of the sequence)
[1] 0 20 40 60 80
Notice that the arguments are named in the function, the arguments in the function seq() function are from, to, by.
We can create our own functions, which we will talk more about in the labs
Variables in R
numeric, continuous numeric variables WITH any decimal values. For example: KG of product imported, probability of an event happening.
integer, Whole numbers WITHOUT decimal values. For example: Number of animals, number of shipments, etc..
character, Alphanumeric variables. For example: name of a region, name of a disease, farm ID.
factor, Alphanumeric variable with specific categories or levels. For example: type of product imported, type of farm, etc…
Test time!
x <-seq(from =5, to =23, length.out =10) # create a sequence of numbersy <-seq(from =0.1, to =0.78, length.out =10) # Create another sequencemean(x*y) # Get the mean of the multiplication
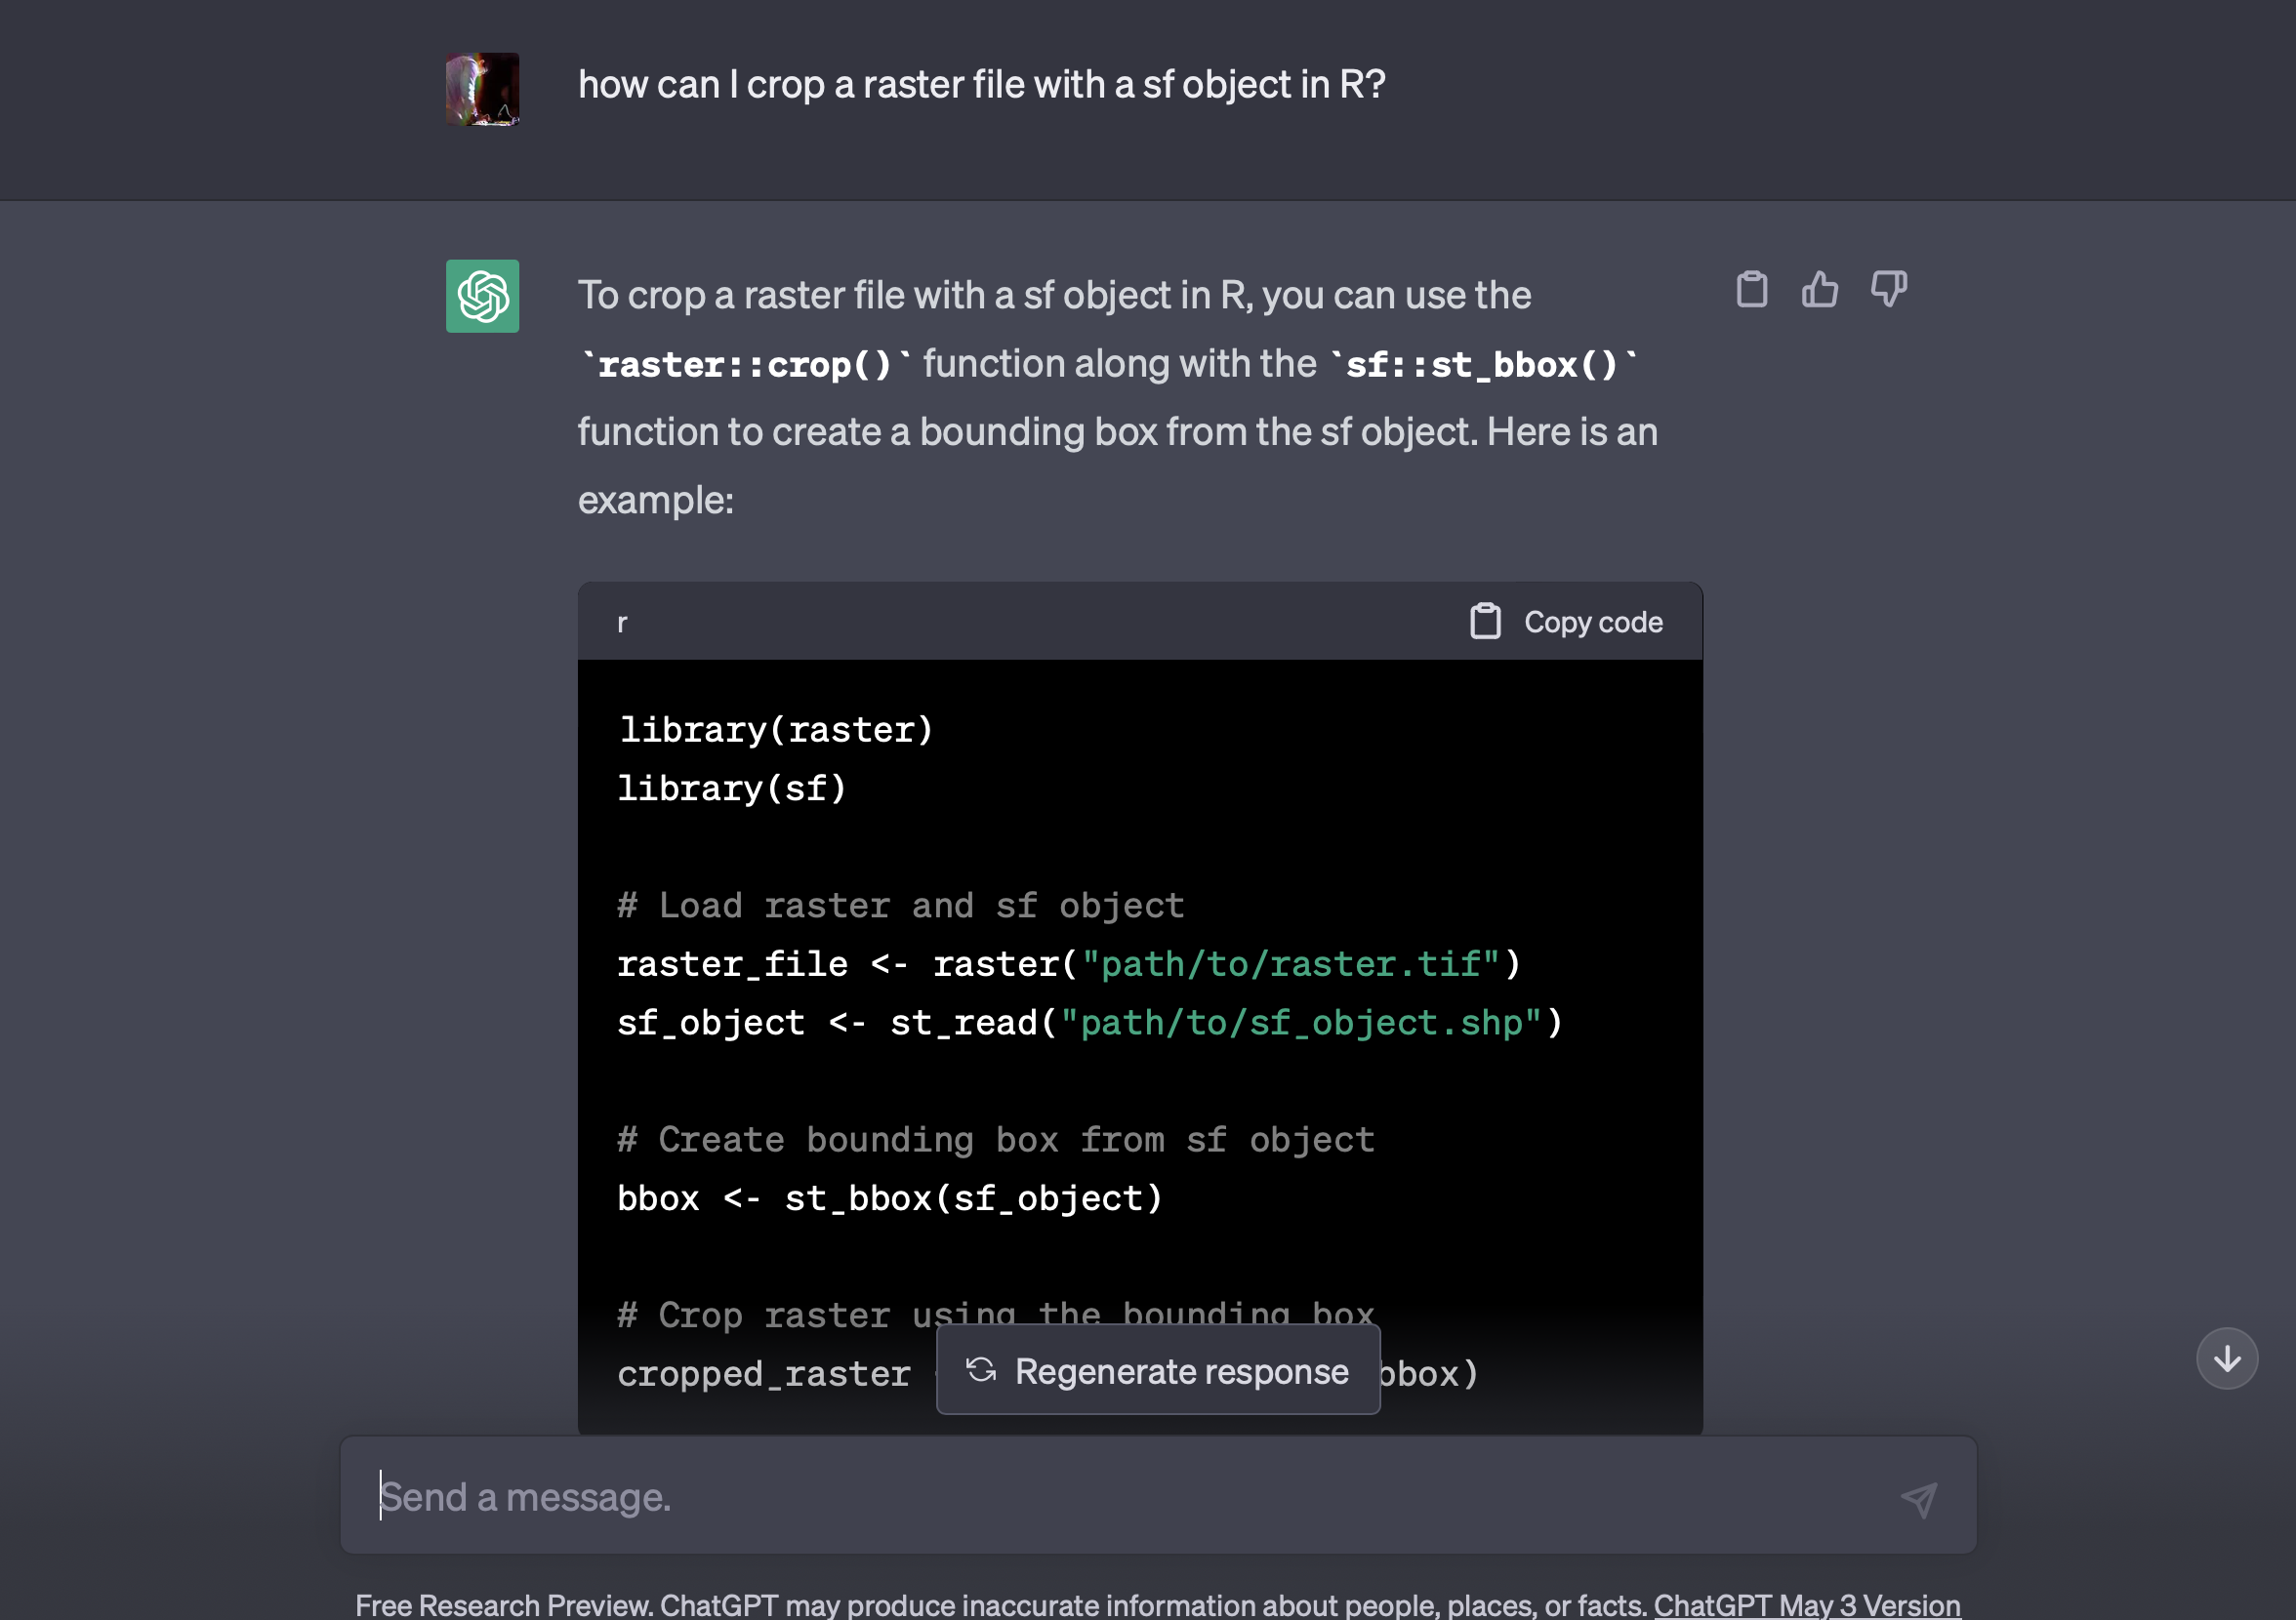
! WARNING: CHAT GPT CAN GIVE INCORRECT INFORMATION !
If chat GPT does not knows something, sometimes will make up information (i.e. made up references, name of packages, libraries etc…)
Make sure to verify the information provided by Chat GPT
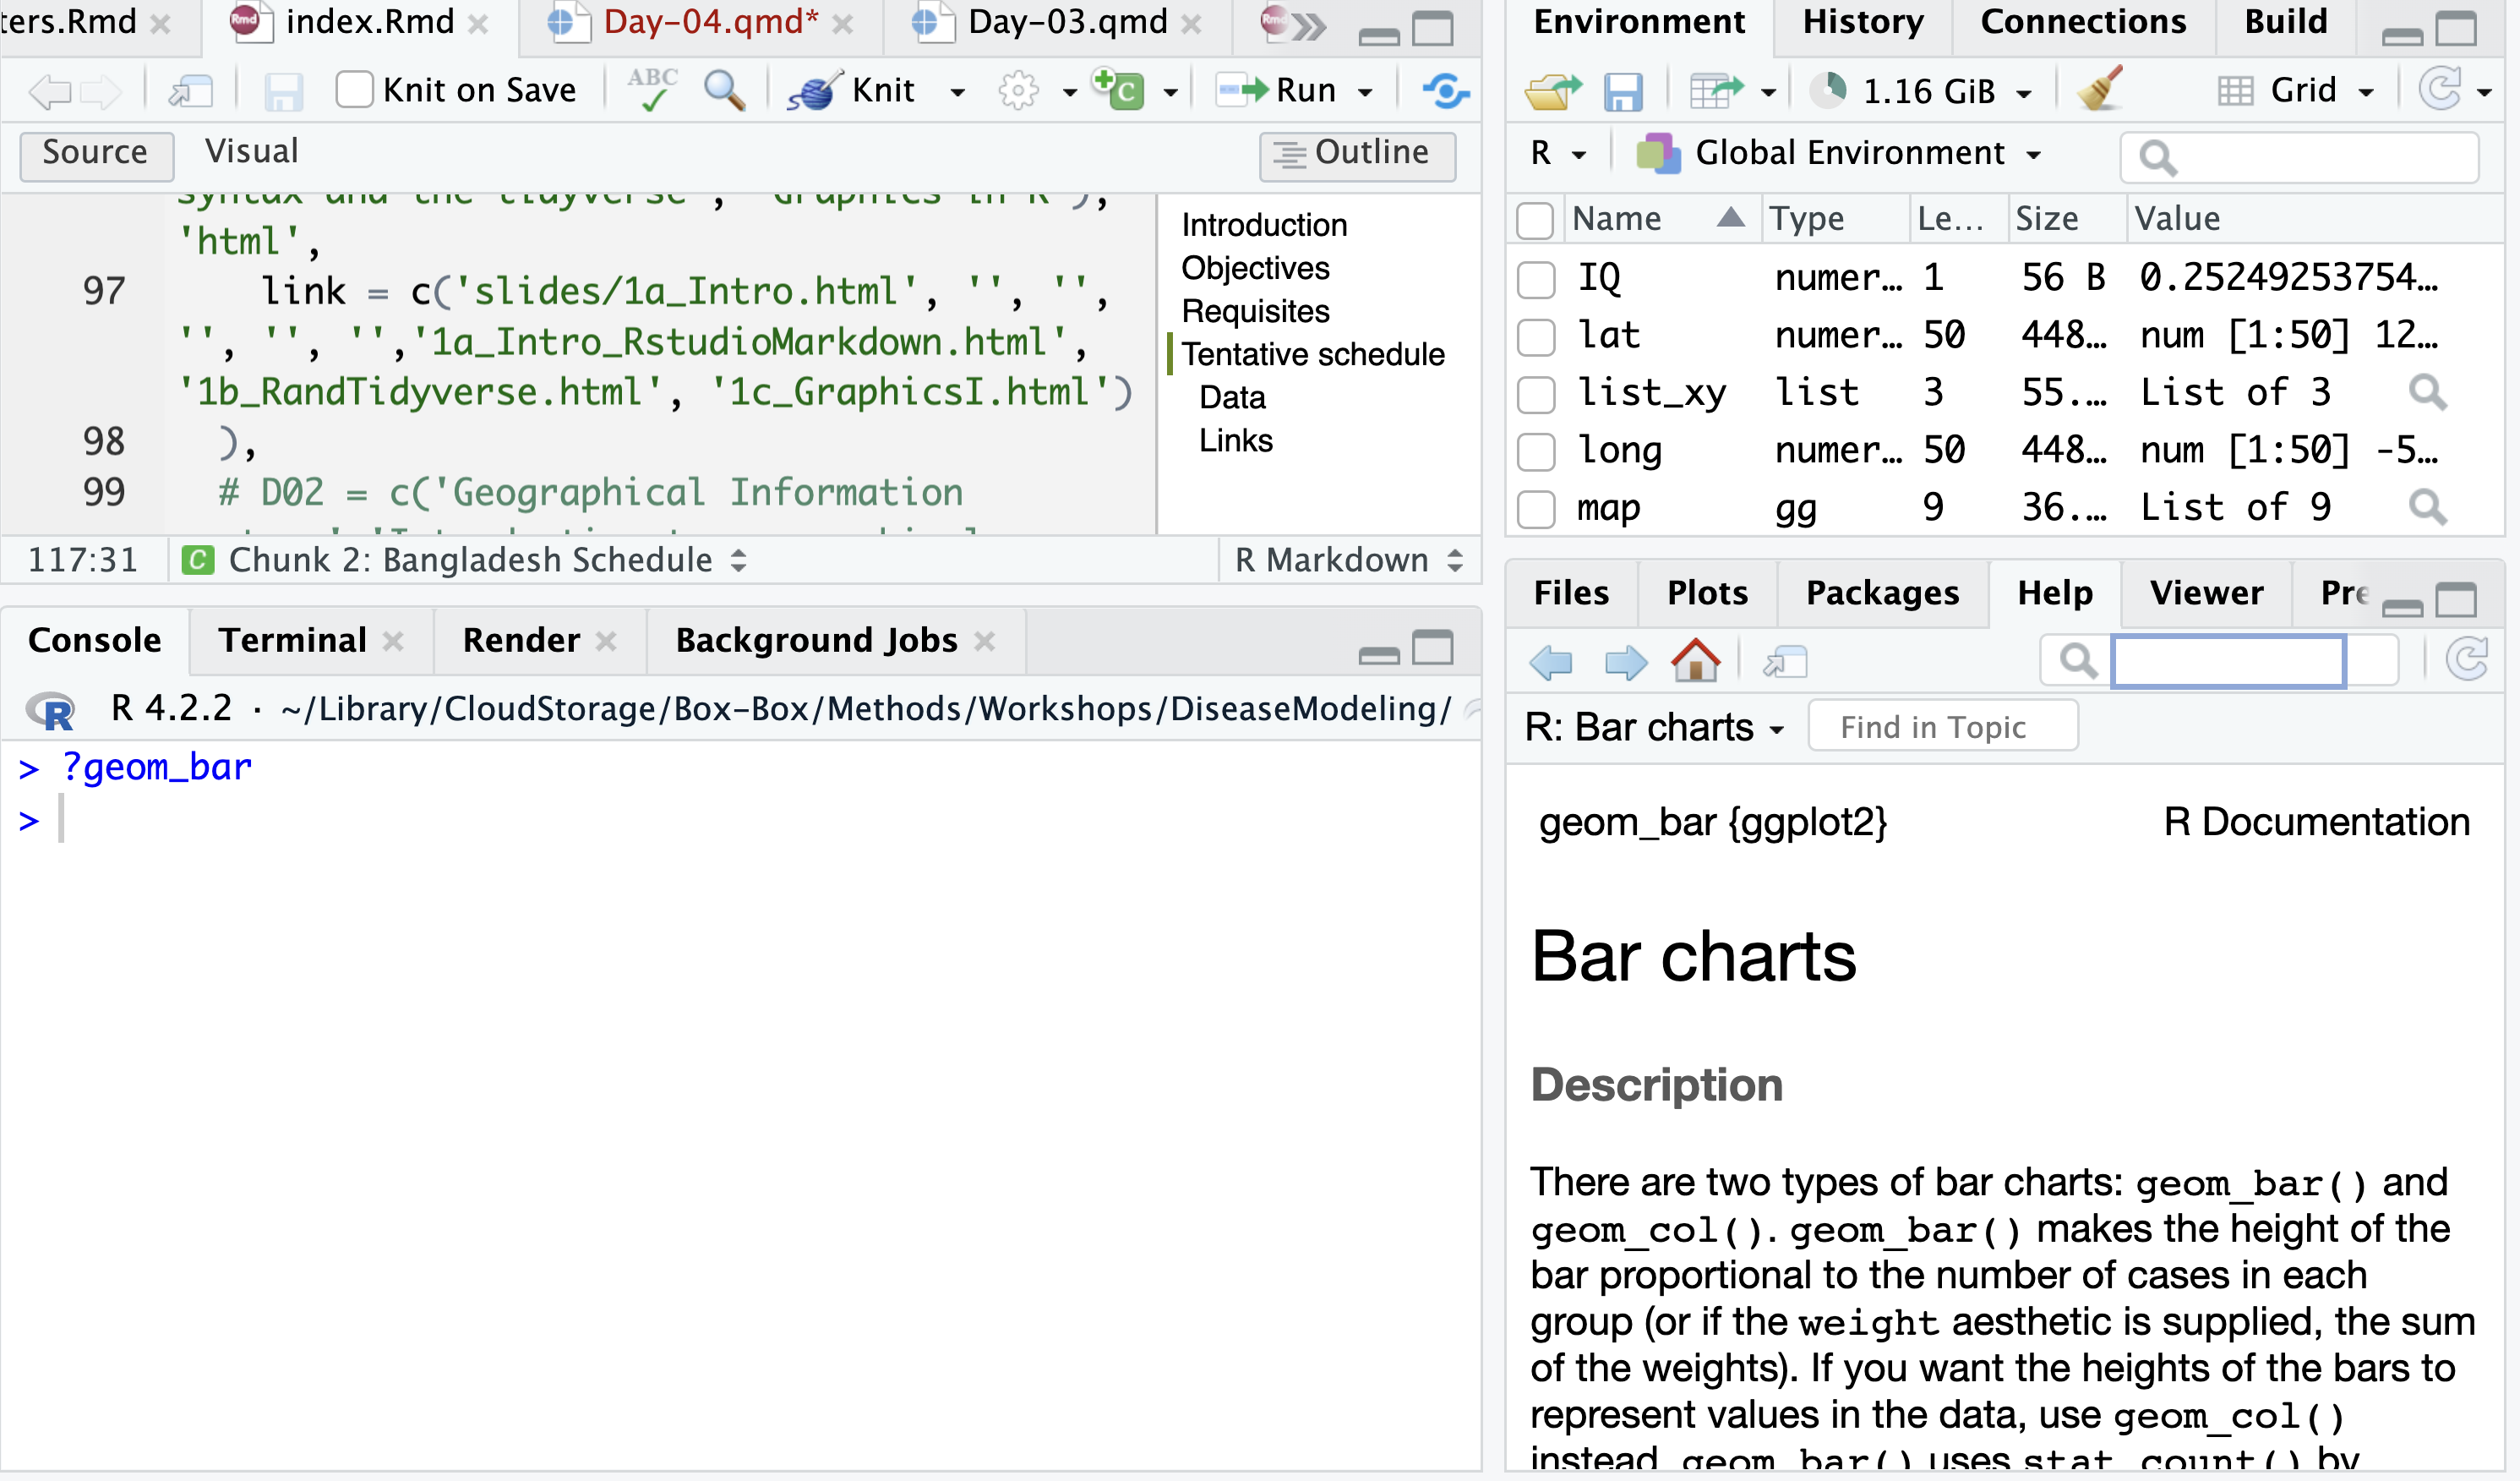
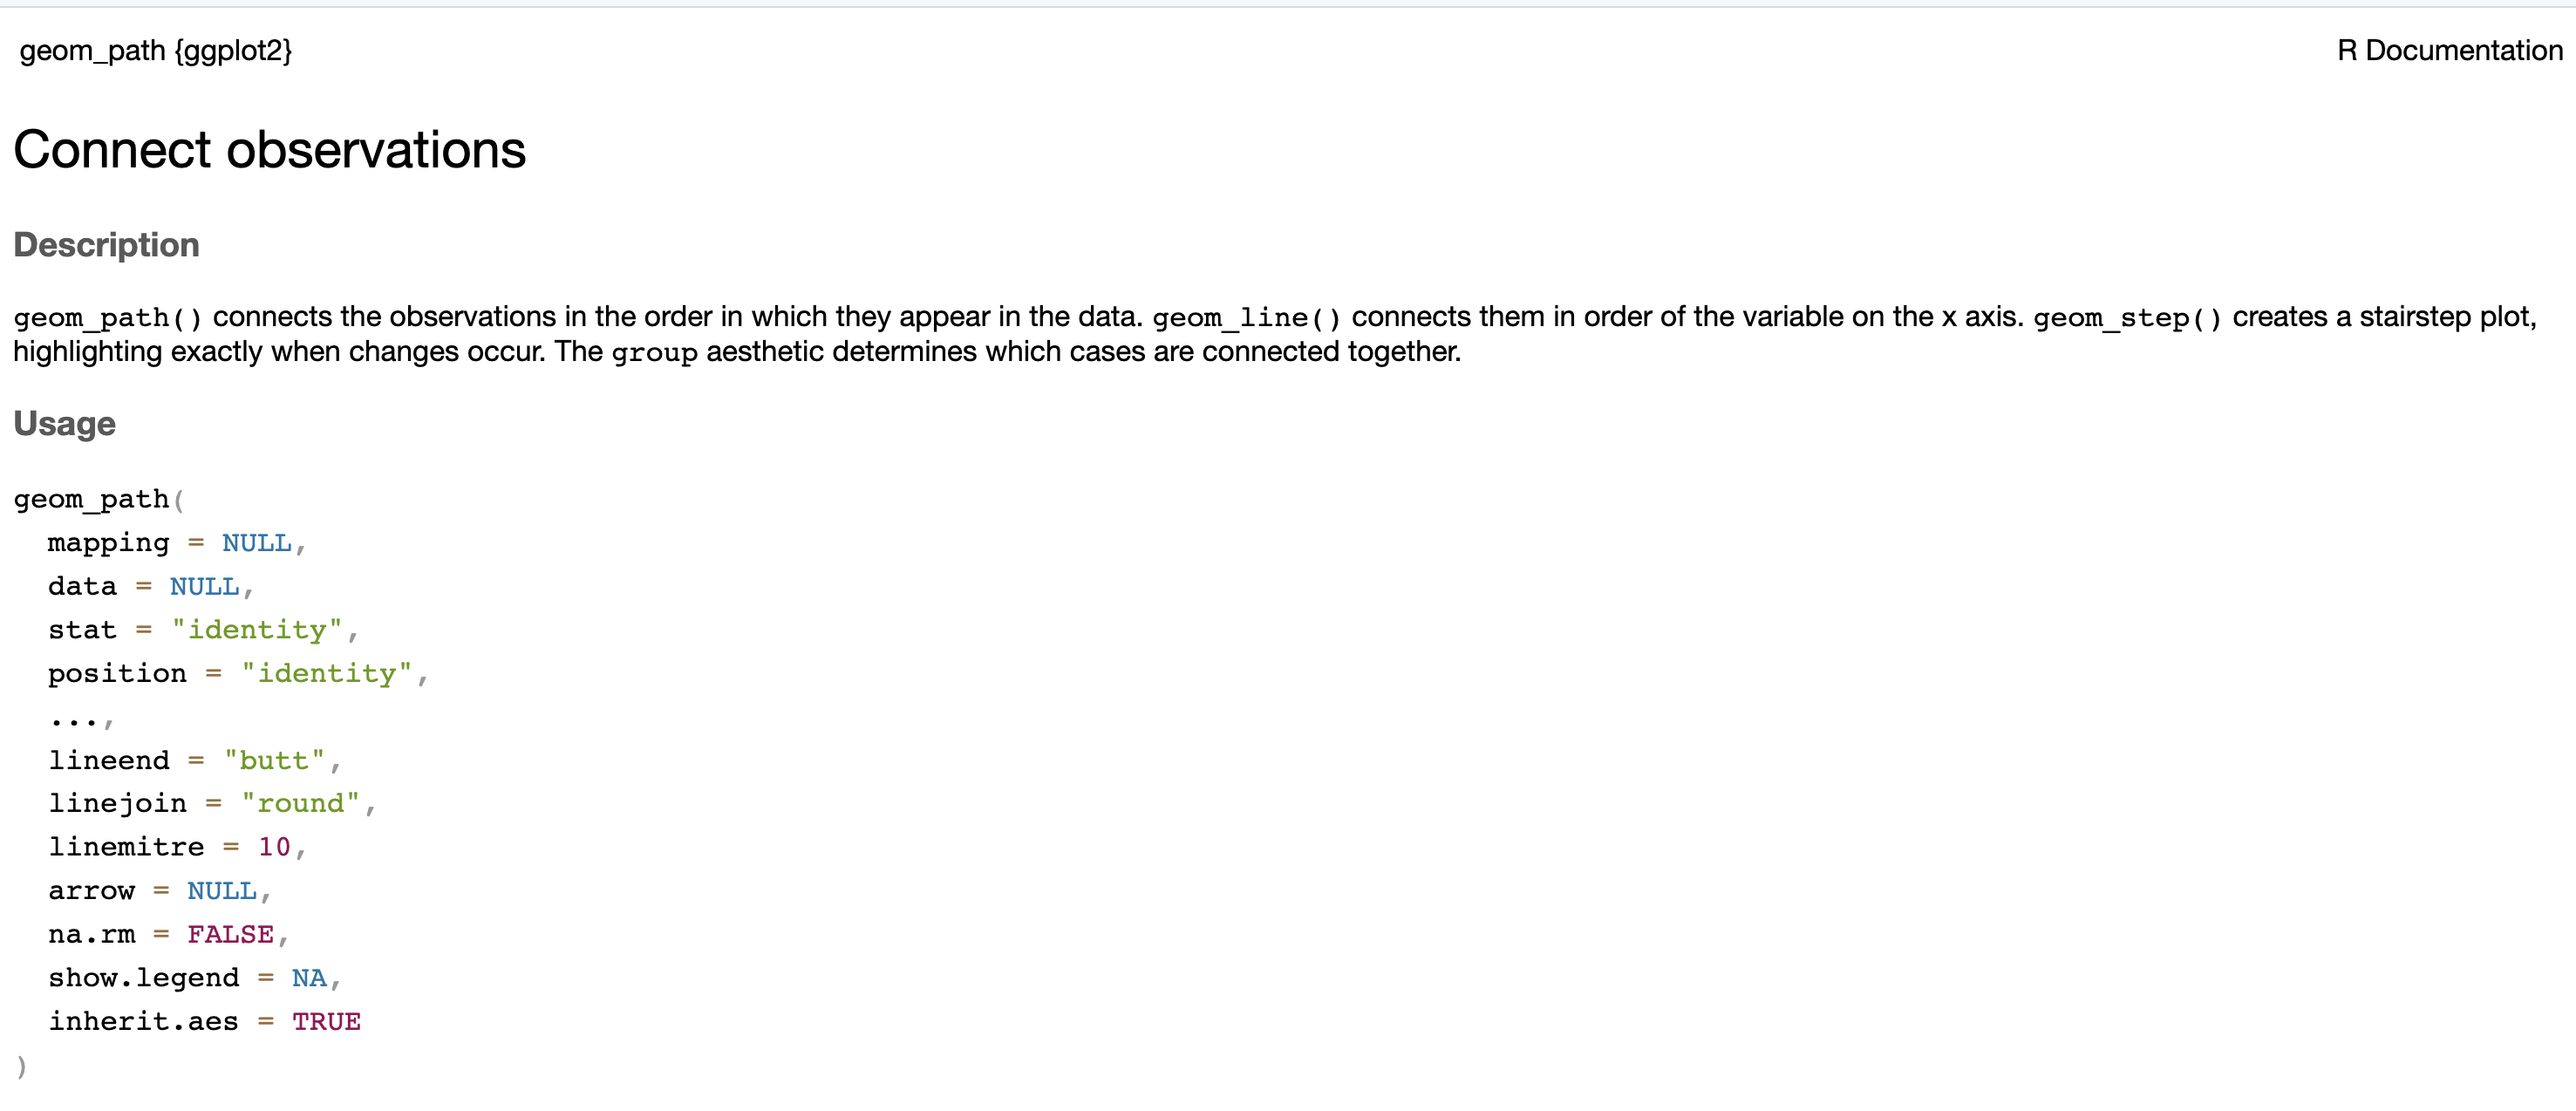
How can we find help with R?
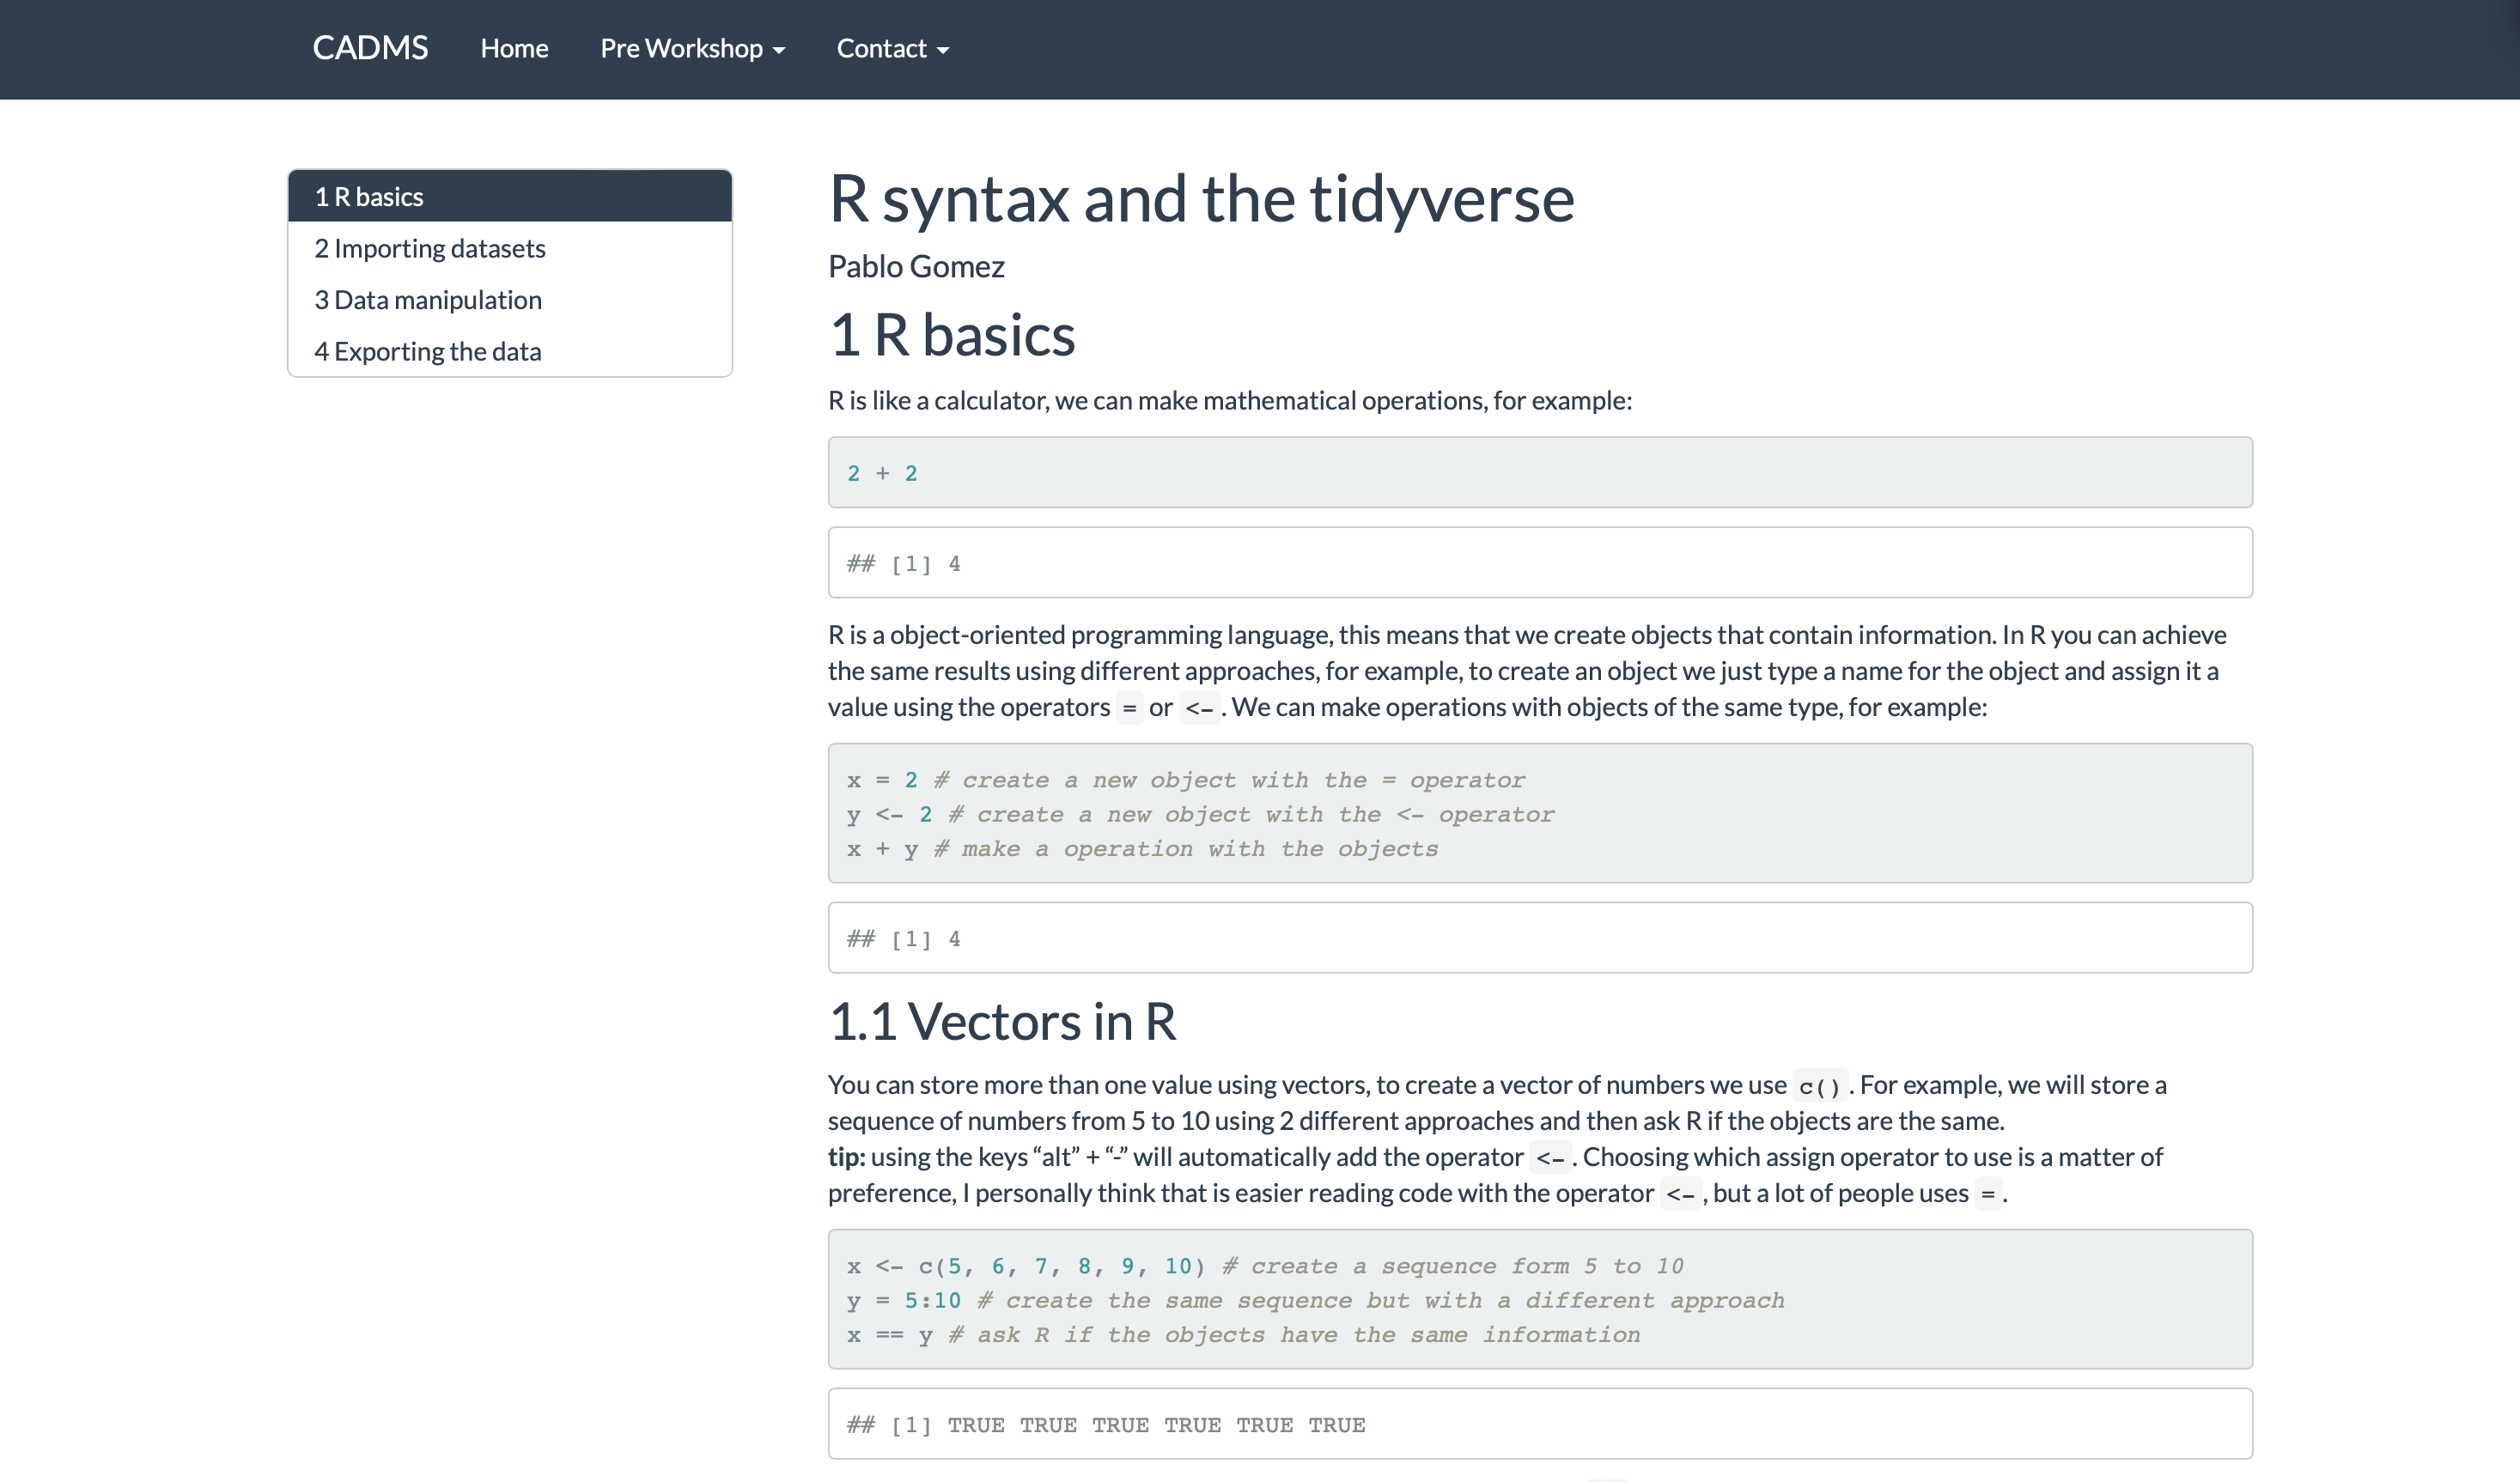
R syntax
R Syntax
R is like a calculator, we can make mathematical operations, for example:
x =2# create a new object with the = operatory <-2# create a new object with the <- operatorx + y # make a operation with the objects
[1] 4
Vectors in R
You can store more than one value using vectors, to create a vector of numbers we use c().
x <-c(5, 6, 7, 8, 9, 10) # create a sequence form 5 to 10y =5:10# create the same sequence but with a different approachx == y # ask R if the objects have the same information
[1] TRUE TRUE TRUE TRUE TRUE TRUE
Using the keys “alt” + “-” will automatically add the operator <-.
Vector operations
When we have a vector, we can ask R specific values inside an object by using the operator [ ] and specifying which ones we want.
x
[1] 5 6 7 8 9 10
# Here we ask the 3rd value from our sequencex[3]
[1] 7
Vector operations
When we have a vector, we can ask R specific values inside an object by using the operator [ ] and specifying which ones we want.
x
[1] 5 6 7 8 9 10
y
[1] 5 6 7 8 9 10
# Now we multiply the 3rd value of the x sequence times the 5th value of the y sequencex[3] * y[5]
[1] 63
Functions
# To get the sum of a vector of numbers inside an object we use sum()sum(x)
[1] 45
Functions
We can put functions inside function, for example, to get \(\sqrt{\sum_1^n x}\) the square root of a sum of the numbers in x we can use:
sqrt(sum(x))
[1] 6.708204
Making functions
The following function has only one argument which is a name (string) and just pastes some text before and after:
F1 <-function(name){paste("Hola", name, "! welcome to the R world (: !") # paste the name with some text}# Testing the function (Put your name)F1(name ="Pablo")
[1] "Hola Pablo ! welcome to the R world (: !"
Remember this?
\[\sqrt{\sum_1^n x}\]
sqrt(sum(x))
Introducing the pipes %>%
Pipes (%>%), can connect several functions to an object.
For example, if we want to execute a function F1() followed by another function F2() for the object x:
F2(F1(x))
is equivalent to:
x %>%F1() %>%F2()
For example
\[\sqrt{\sum_1^n x}\]
Instead of this:
sqrt(sum(x))
We can write it like this:
x %>%sum() %>%sqrt()
For example
Instead of this:
# Get the number of outgoing and incoming shipments Out <-rename(summarise(group_by(mov, id_orig), Outgoing =n()), id = id_orig)
We can write this:
# Get the number of outgoing and incoming shipments Out <- mov %>%group_by(id_orig) %>%summarise(Outgoing =n()) %>%rename(id = id_orig)
For example
Instead of this:
# Get the number of outgoing and incoming shipments Out <-rename(summarise(group_by(mov, id_orig), Outgoing =n()), id = id_orig)
We can write this:
# Get the number of outgoing and incoming shipments Out <- mov %>%# This is the movement data setgroup_by(id_orig) %>%# Group by originsummarise(Outgoing =n()) %>%# Count the number of observationsrename(id = id_orig) # Rename the variable
And we can break down the code easier!
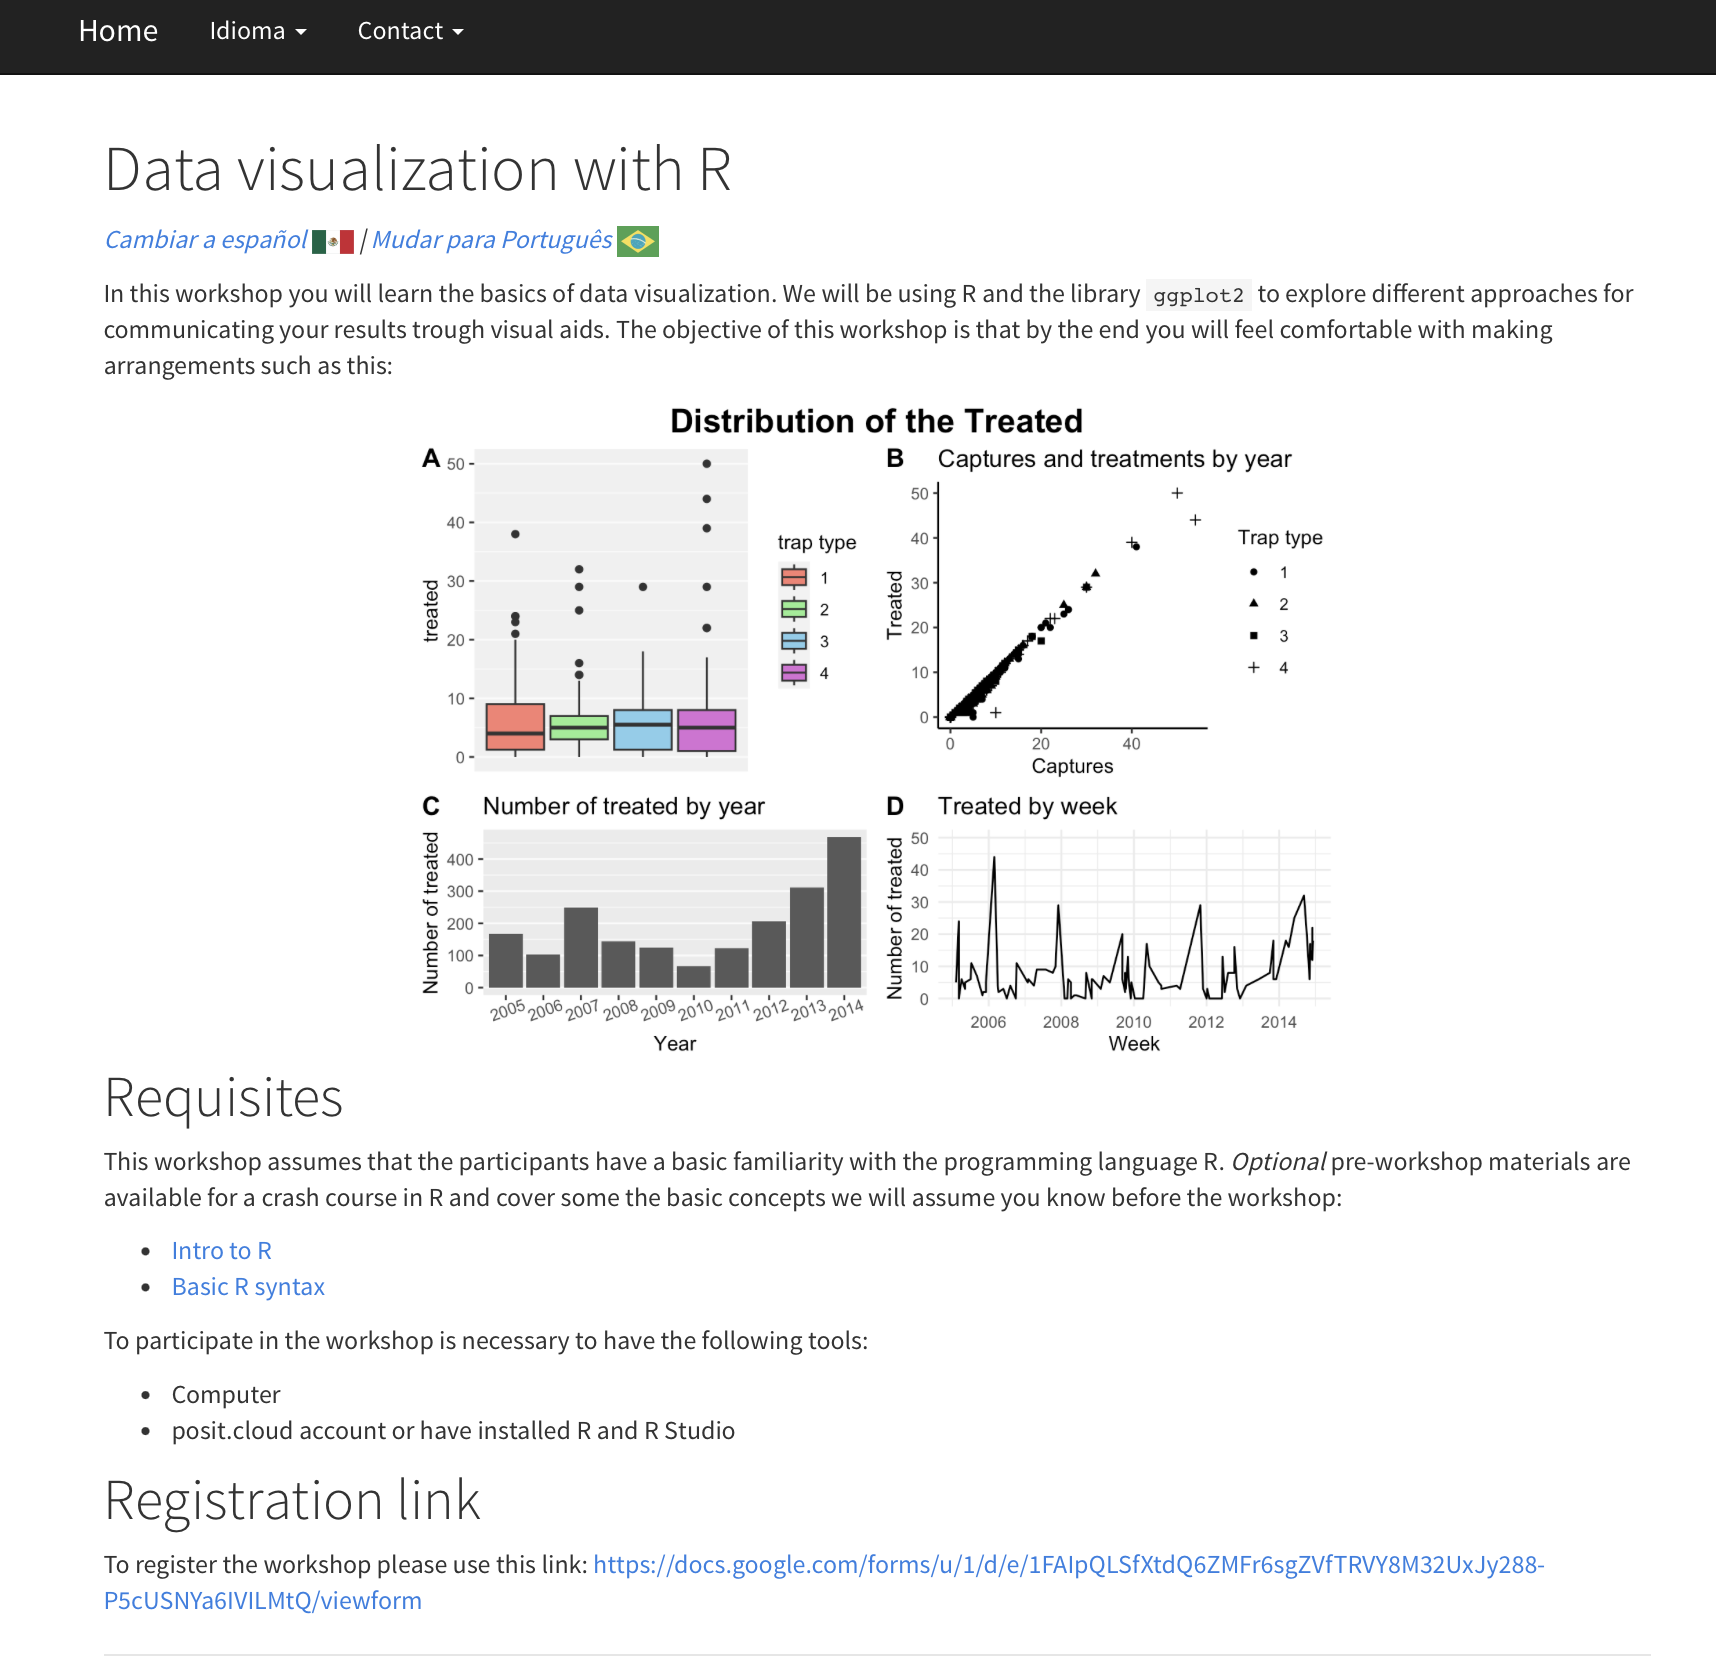
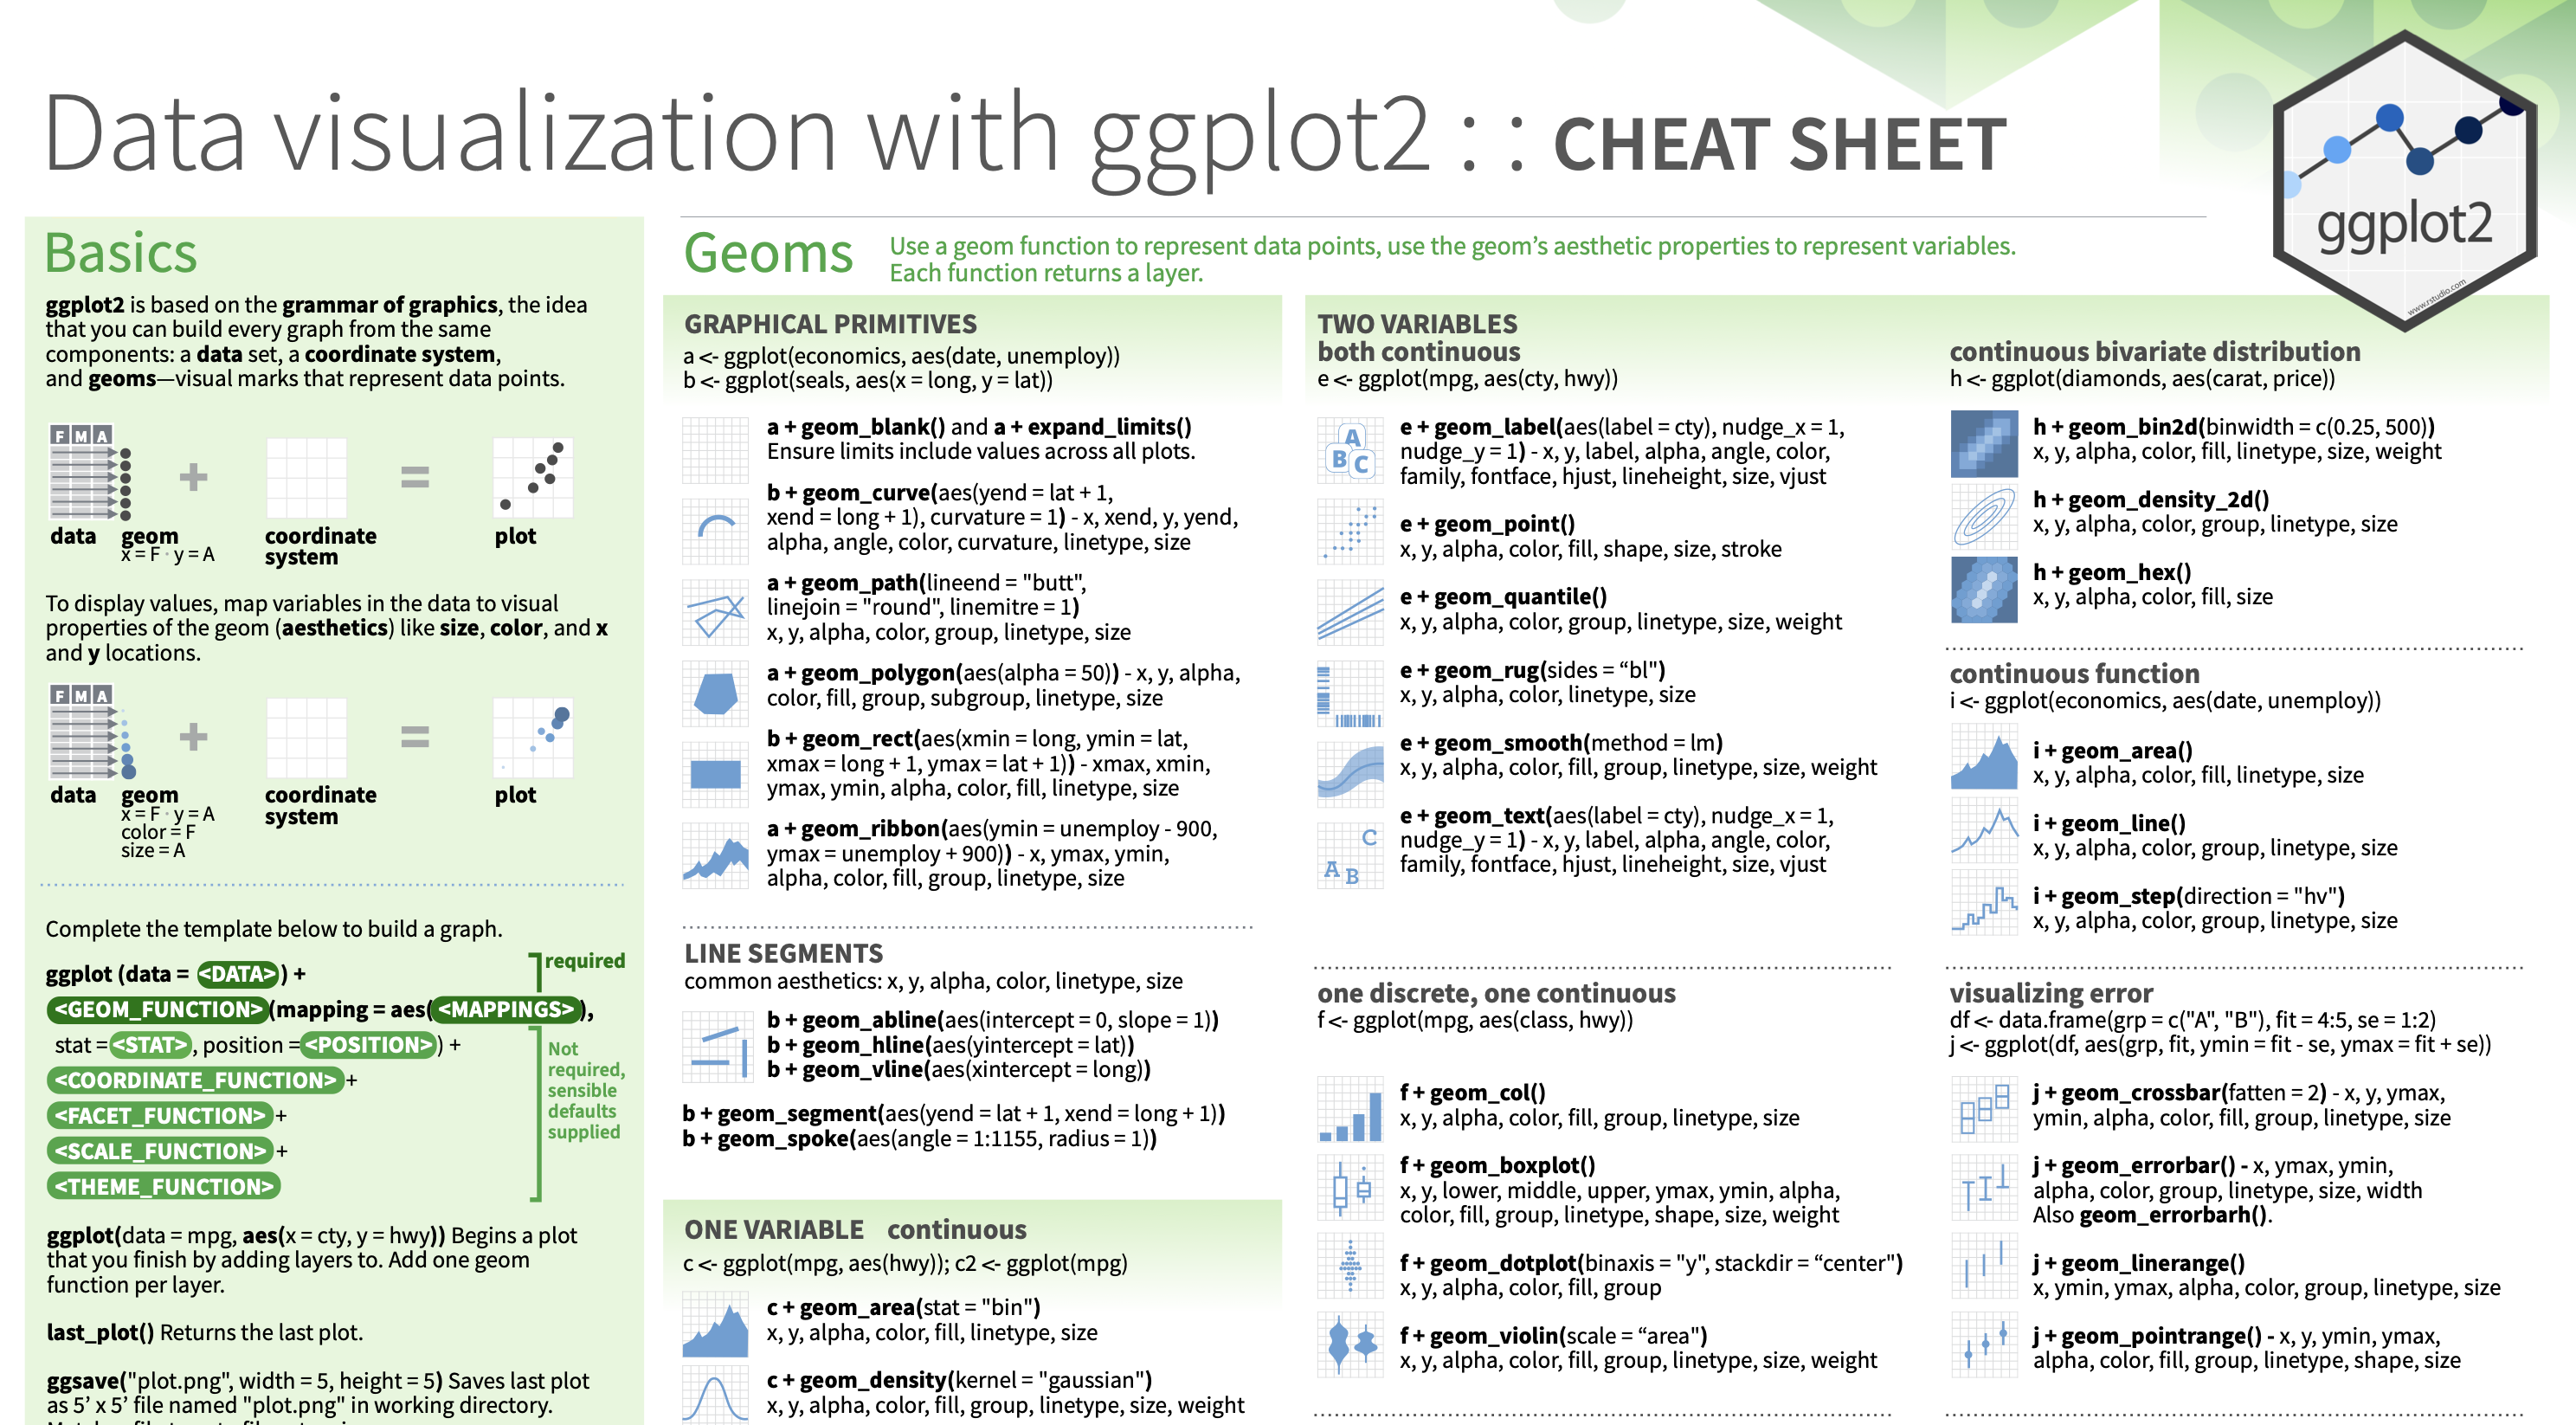
Data visualization
ggplot2
We build our figures based on layers
Similar syntax as dplyr
We can combine data wrangling and visualization into a single code chunk
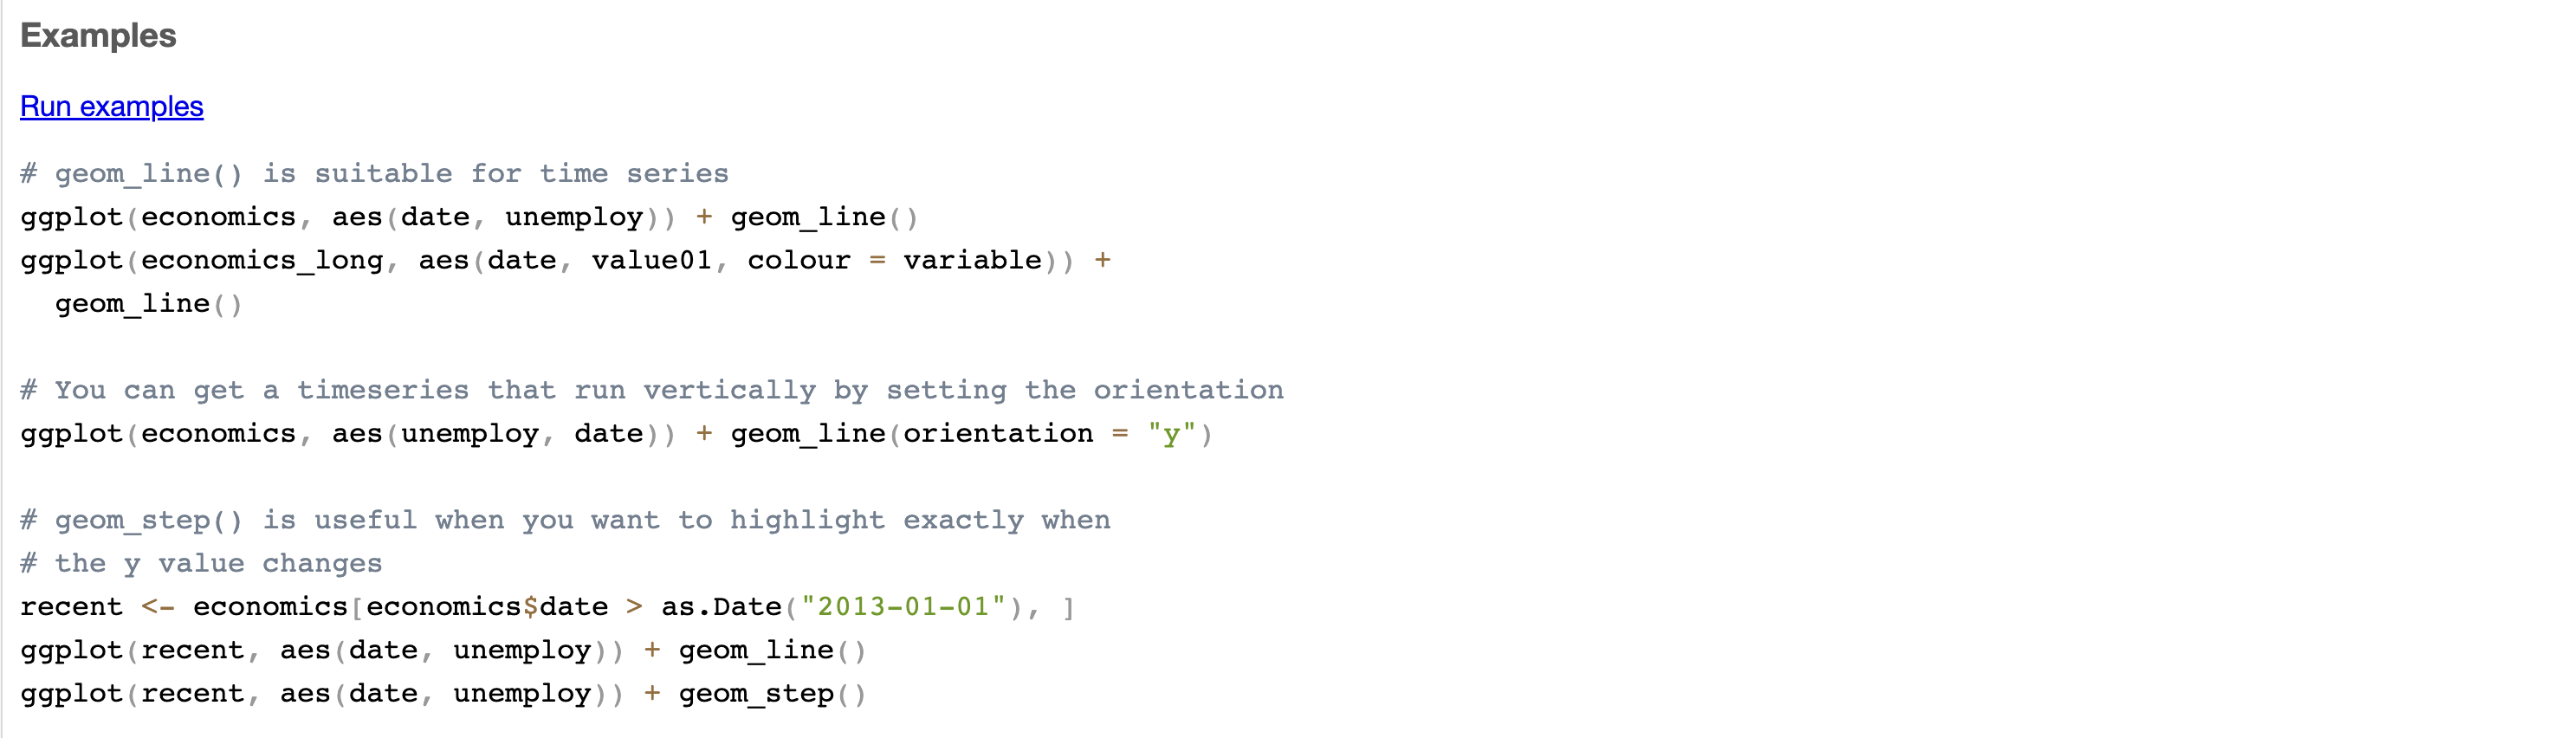
Lectures
Instead of the %>%, in ggplot we connect pieces of code with +
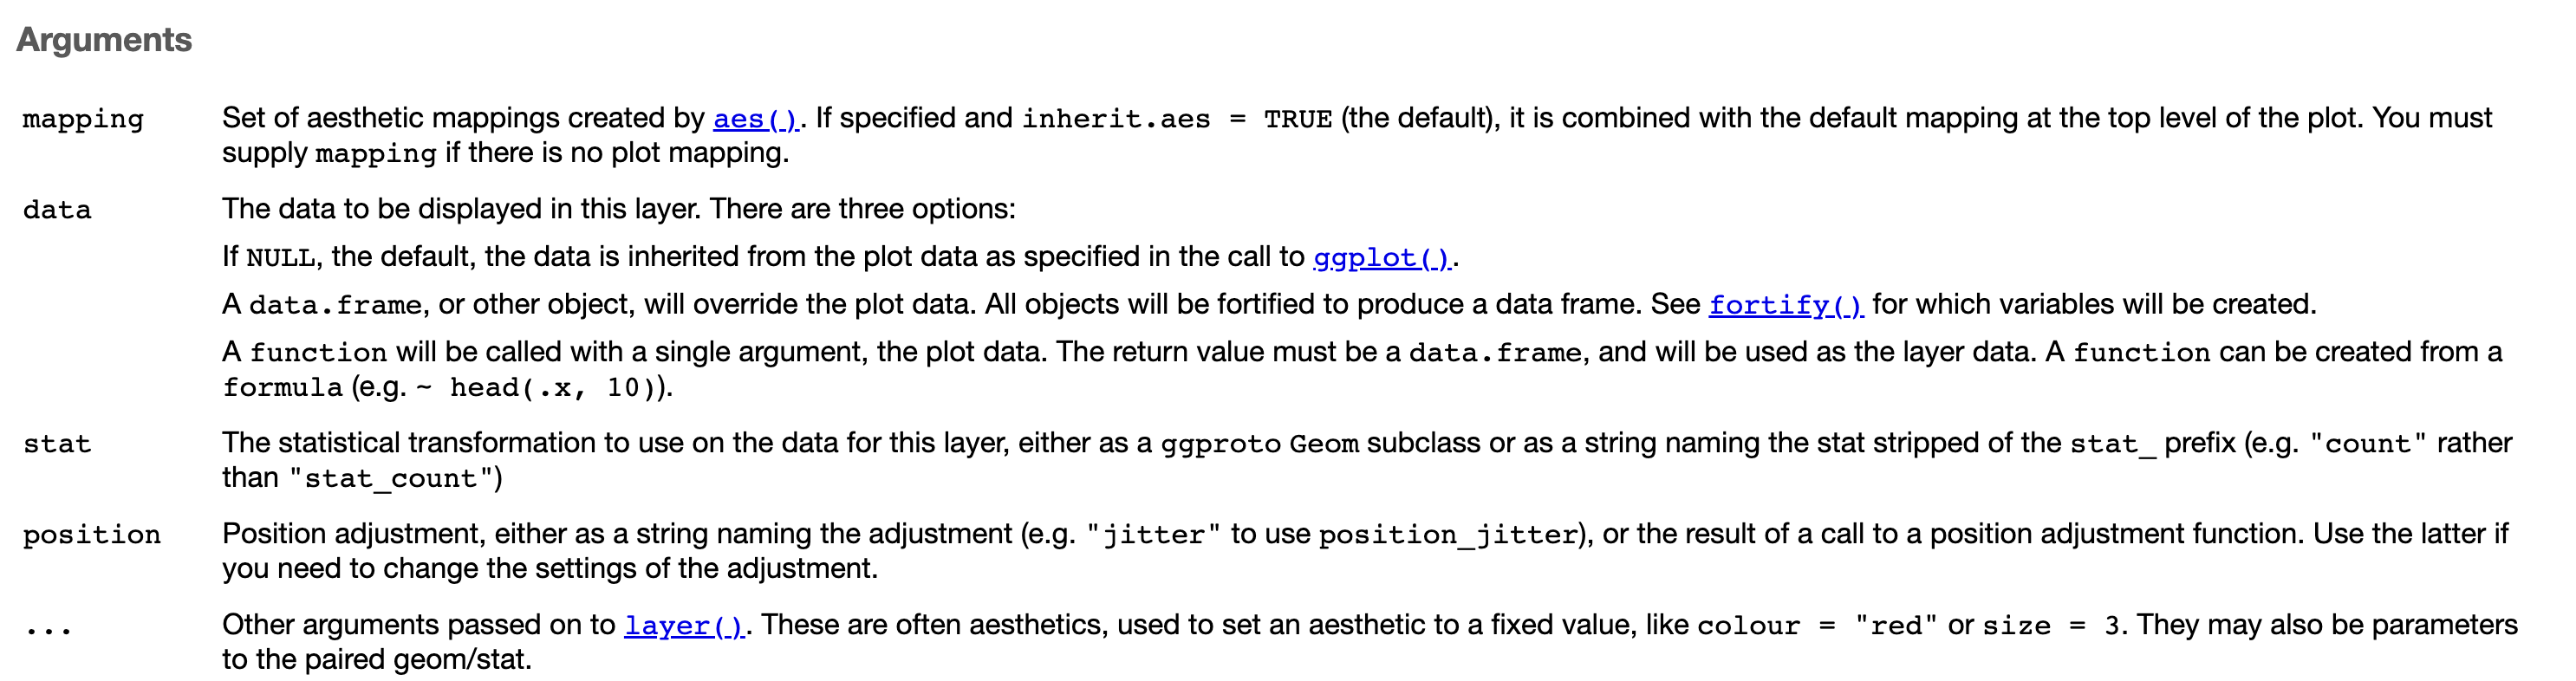
ggplot2
The basic components that we need to define for a plot are the following:
data, the data set we will use to generate the figure
geometry, or type of graphic we will generate (i.e. histogram, bar, scatter, etc..)
aesthetic, variables or arguments that will be used for the figure for example: location, color, size, etc..
Example
captures # Data
municipality
location
Loc
date
year
captures
treated
lat
lon
trap_type
Temascaltepec
San Pedro Tenayac
Cueva el Uno
11/06/14
2014
6
6
18.03546
-100.2095
1
Tlatlaya
Nuevo Copaltepec
La alcantarilla
12/05/05
2005
3
2
18.40417
-100.2688
1
Tlatlaya
Nuevo Copaltepec
La alcantarilla
12/05/07
2007
30
29
18.40417
-100.2688
4
Tlatlaya
Nuevo Copaltepec
La alcantarilla
12/03/09
2009
0
0
18.40417
-100.2688
3
Tlatlaya
Nuevo Copaltepec
La alcantarilla
10/08/10
2010
4
3
18.40417
-100.2688
1
Example
captures %>%# Data usedcount(year, wt = treated) # Some data transformation
year
n
2005
167
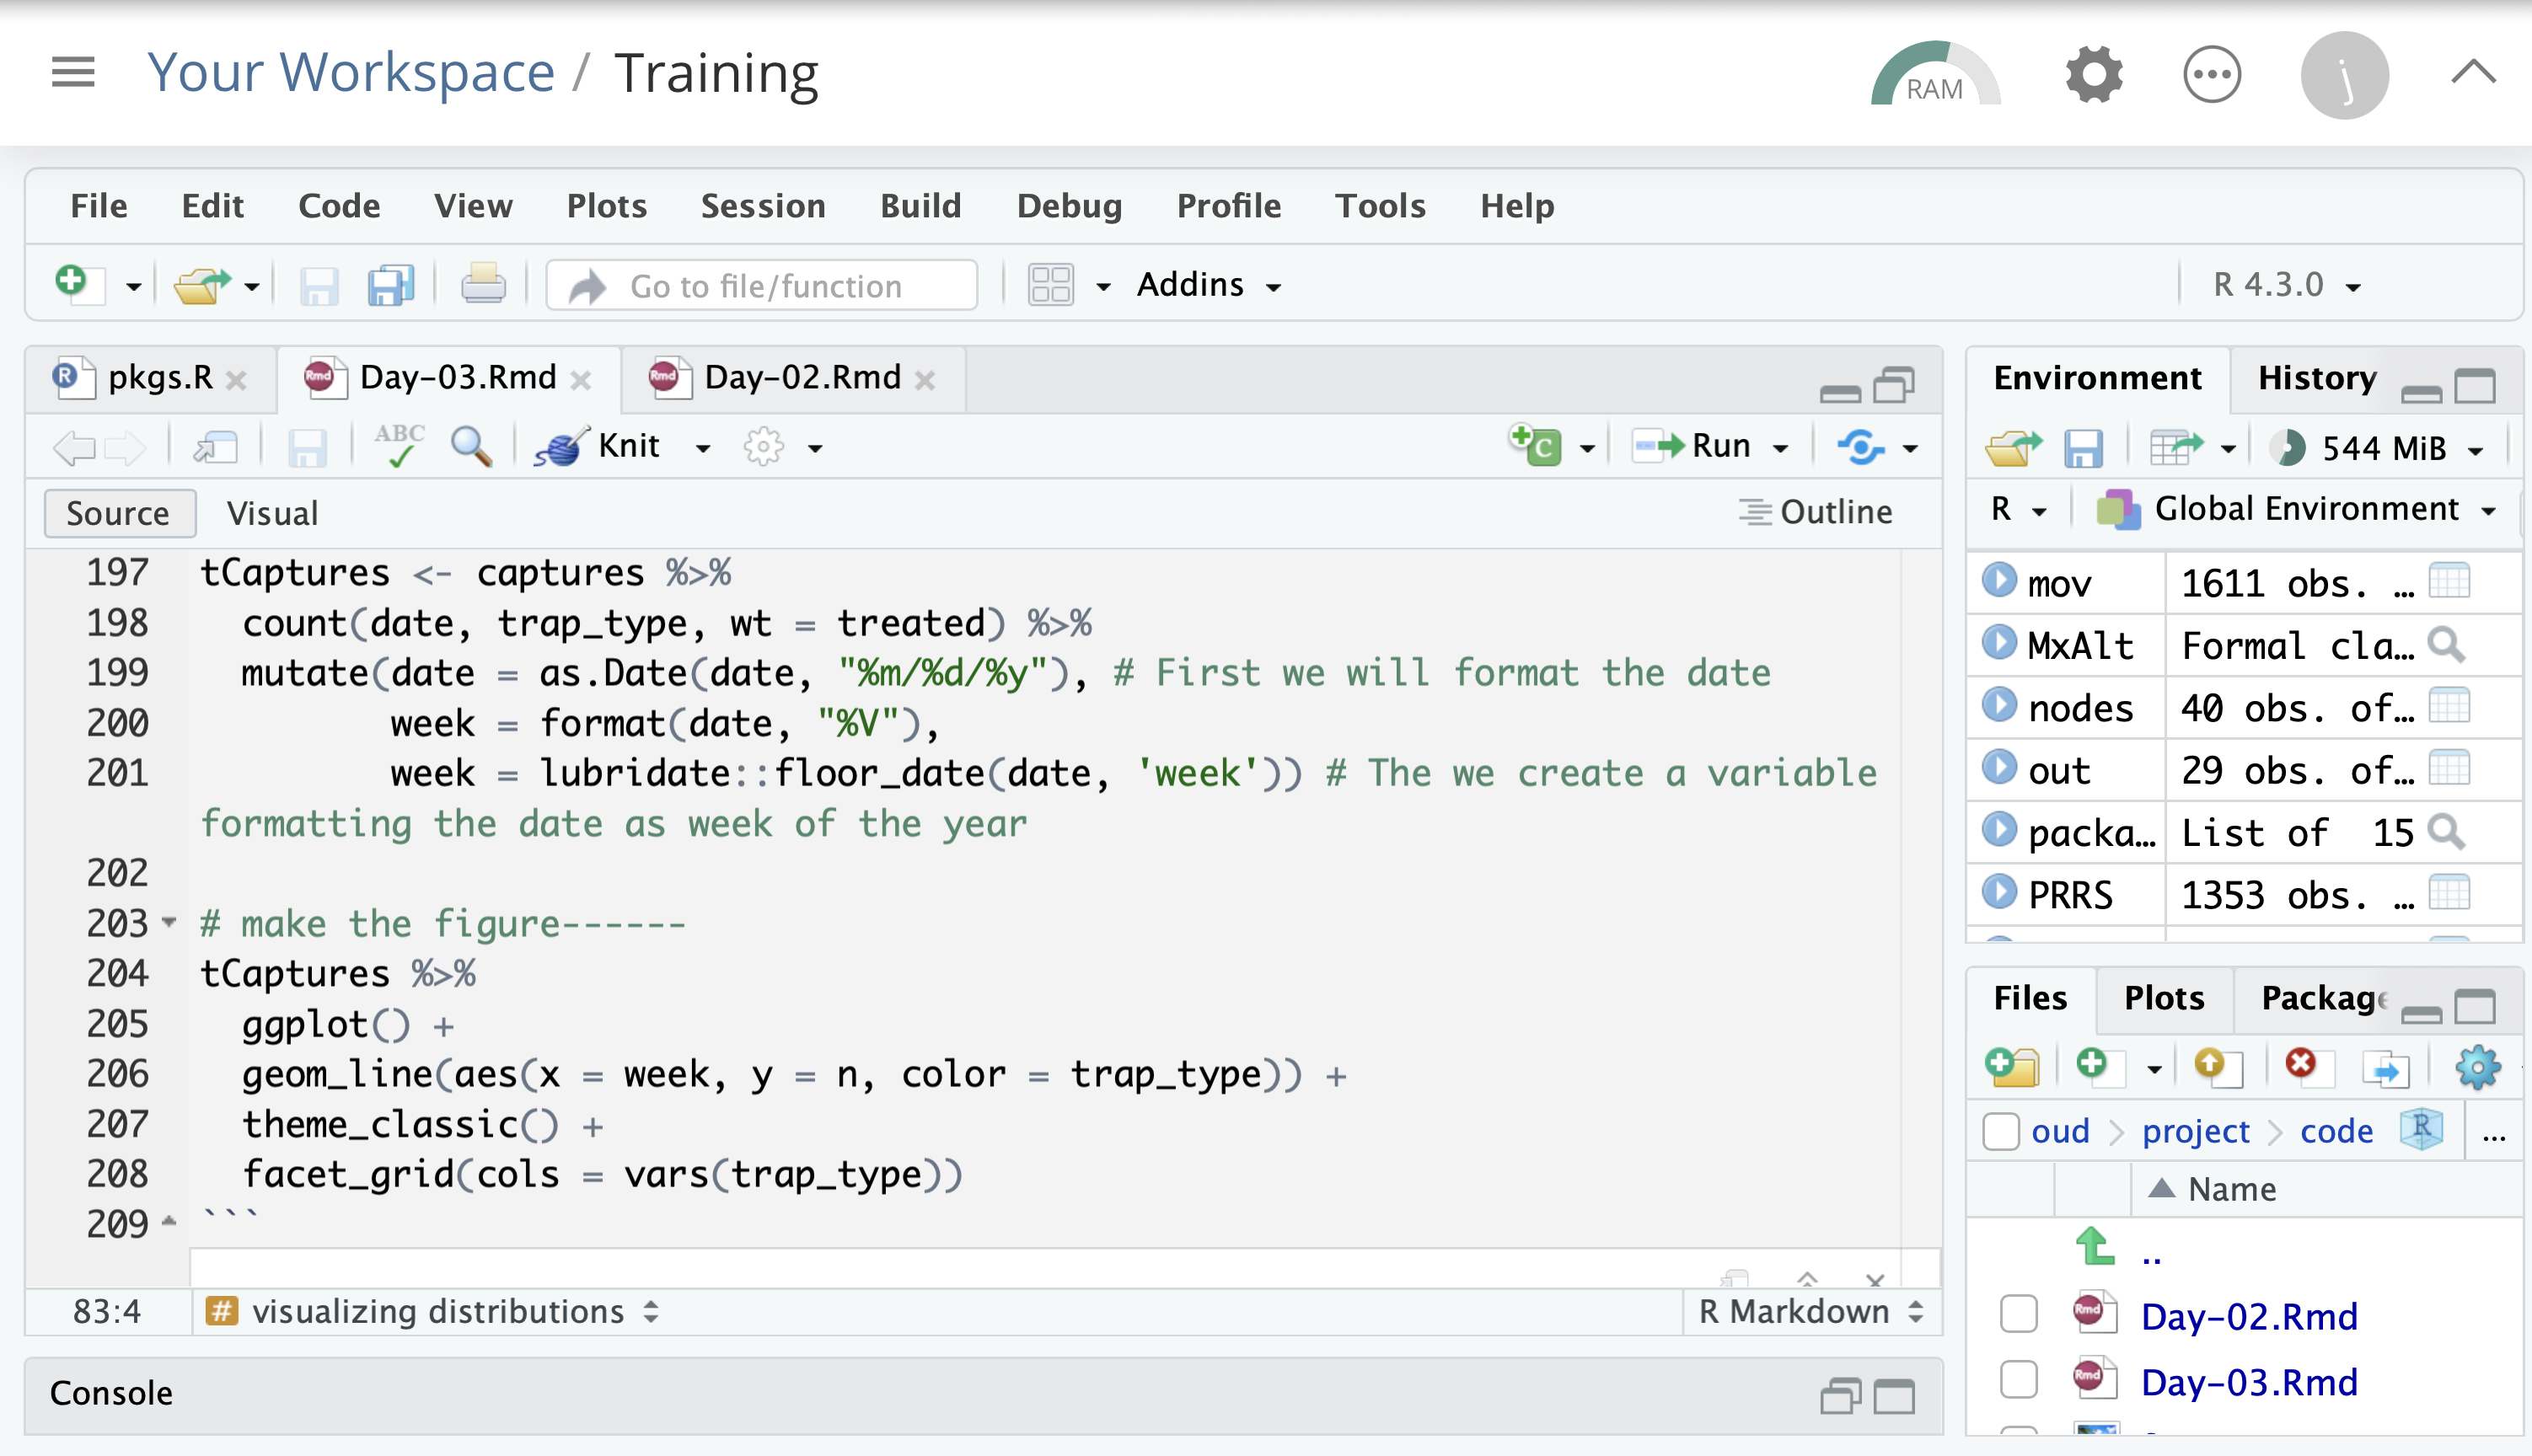
2006
103
2007
249
2008
143
2009
125
Example
captures %>%# Data usedcount(year, wt = treated) %>%# Some data wranglingggplot() # Add an empty canvas
Example
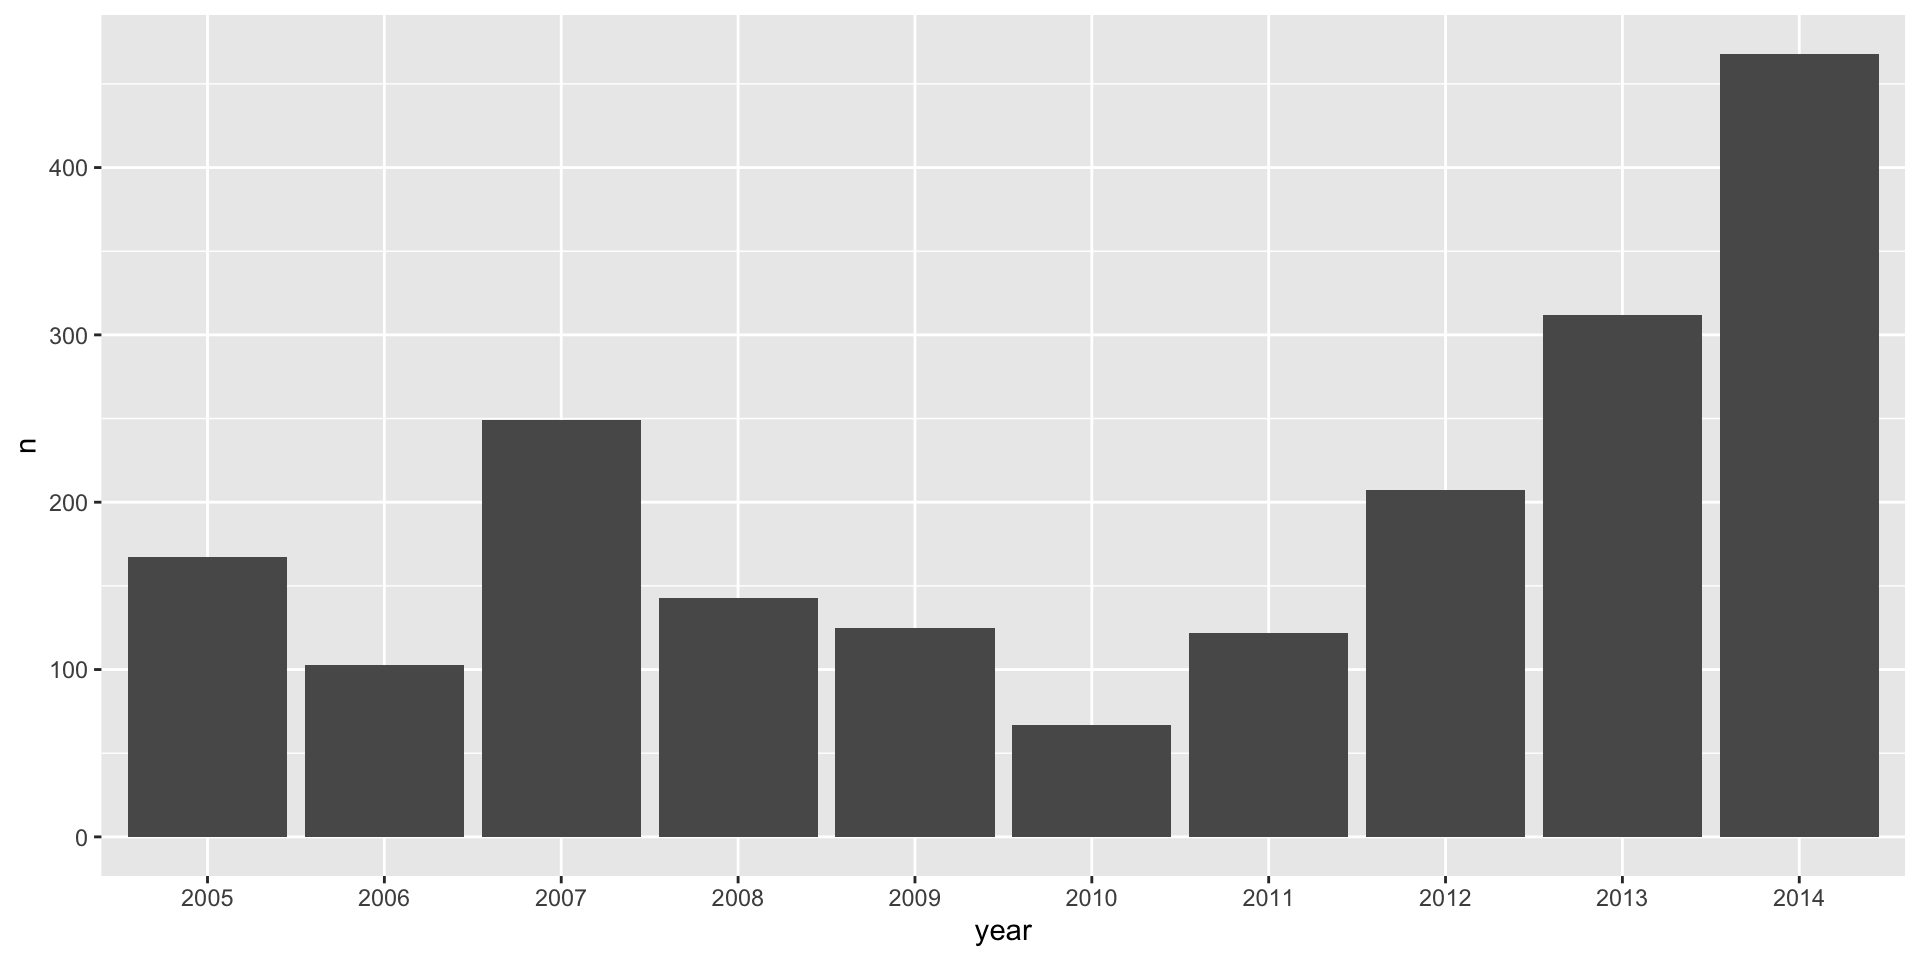
captures %>%# Data usedcount(year, wt = treated) %>%# Some data wranglingggplot() +# Add an empty canvasgeom_bar() # This is the geometry type
Example
captures %>%# Data usedcount(year, wt = treated) %>%# Some data wranglingggplot() +# Add an empty canvasgeom_bar( # This is the geometry typeaes( # Aesthetics or mappingx = year, # X axisy = n # Y axis ), stat ='identity'# extra arguments )
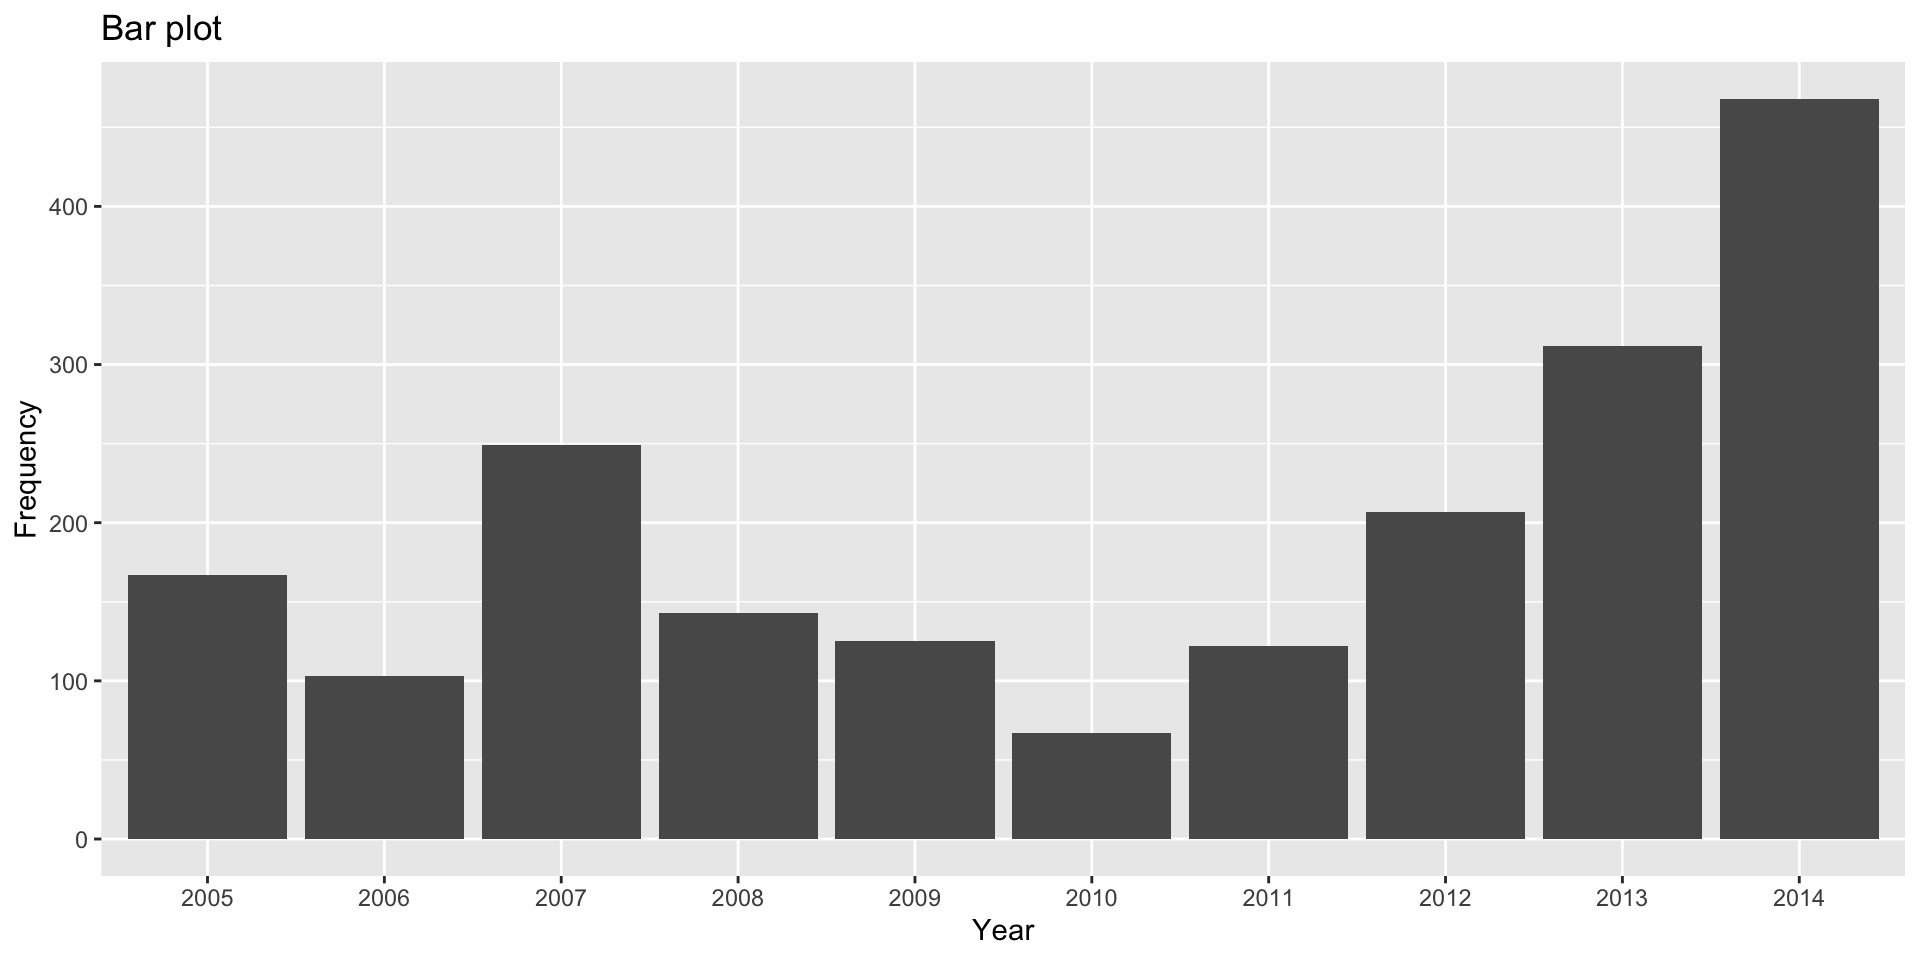
Example
captures %>%# Data usedcount(year, wt = treated) %>%# Some data wranglingggplot() +# Add an empty canvasgeom_bar(aes(x = year, y = n), stat ='identity') +labs(# extra argumentstitle ='Bar plot',x ='Year', y ='Frequency' )


Comments
COMMENT AS MUCH AS POSSIBLE!
What is the difference between line 1 and 2?
YES! the
#character will make everything after it a comment in that line of code