Lab IVb: Improving user experience
1 Objective
In this lab we will go over some more advanced methods to allow the user to interact with the maps in our dashboard.
2 More on User Interaction
In this lab we will work mostly in the
Instead of asking the user to provide the coordinates, we can use the
leaflet map we previously created to select the location directly map.
The leaflet Output can send some input events such as the user clicking
on a map. We can use this as any other input objects and to refer to it
have to any other inputs. For example, if we created the output
leafletOutput('CapturaMap') we can refer to a position
where the user clicks as input$CapturaMap_click.
This will return a list with the coordinates that we can later use.
2.1 Changes in ui.R
We will modify our ui.R to show the coordinate values
with an output instead of an input (as we had it before). We can put
this output wherever we want, I will replace the Lat/Lon inputs we
previously created with a textOutput('MapLoc') that will
have the information coming from the leaflet map
CapturaMap.
box(title = 'Add New Observation', # title of the new box
    width = 12,
    textInput(inputId = 'NameIn', label = 'Name'),
    # numericInput(inputId = 'LatIn', label = 'Latitude', value = 0), # <--- We can delete these inputs now
    # numericInput(inputId = 'LonIn', label = 'Longitude', value = 0),
    textOutput('MapLoc'), #   <---- And use this output to tell us the coordinated selected in the map instead
    actionButton(inputId = 'submit', label = 'Submit')
    )
2.2 Changes in server.R
Then we will make some changes in the server to create the
'MapLoc' output.
First we will create a new reactive object in our
server.R file with this information:
Loc <- reactive({
    c(
      input$CapturaMap_click[[1]], # Latitude
      input$CapturaMap_click[[2]] # Longitude
      )
  })
Using the reactive object Loc() we can create the
'MapLoc' output. We will use an if else statement so when
the user will know that have to click on the map to select the location;
when the user haven’t clicked on the map, the message ‘Click on the map
to get the coordinates’ will be shown; otherwise the coordinates where
the user clicked will be shown
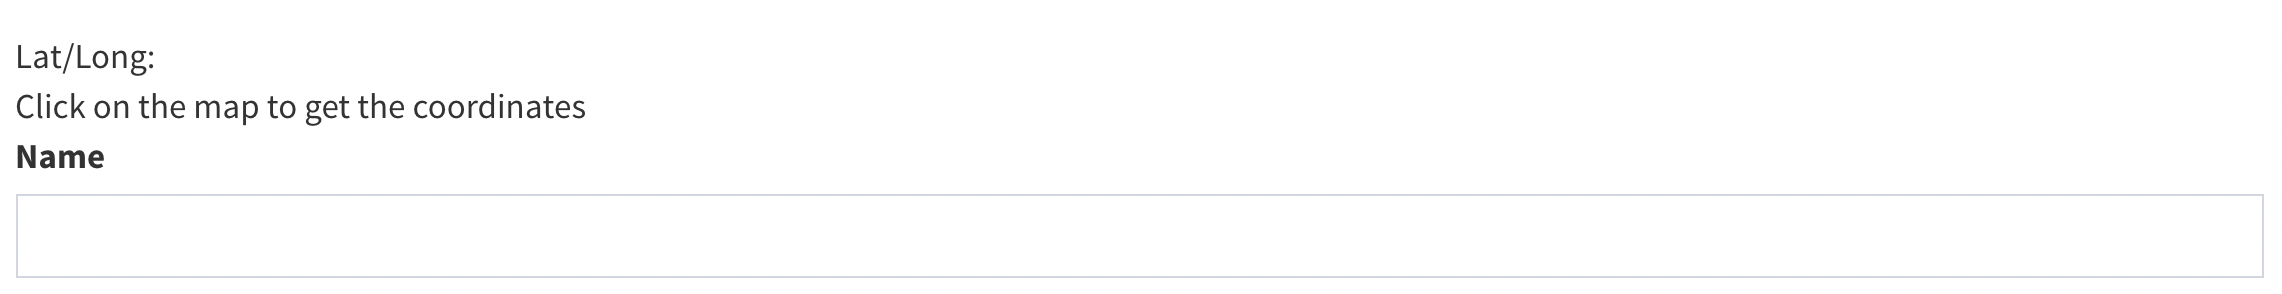
output$MapLoc <- renderText({
    if(is.null(input$CapturaMap_click)){  # Show a message when the object input$CapturaMap_click is null
      'Click on the map to get the coordinates'
    }else{
      Loc() # Show the coordinates otherwise
    }
  })
Before clicking on the map, the user should see this:
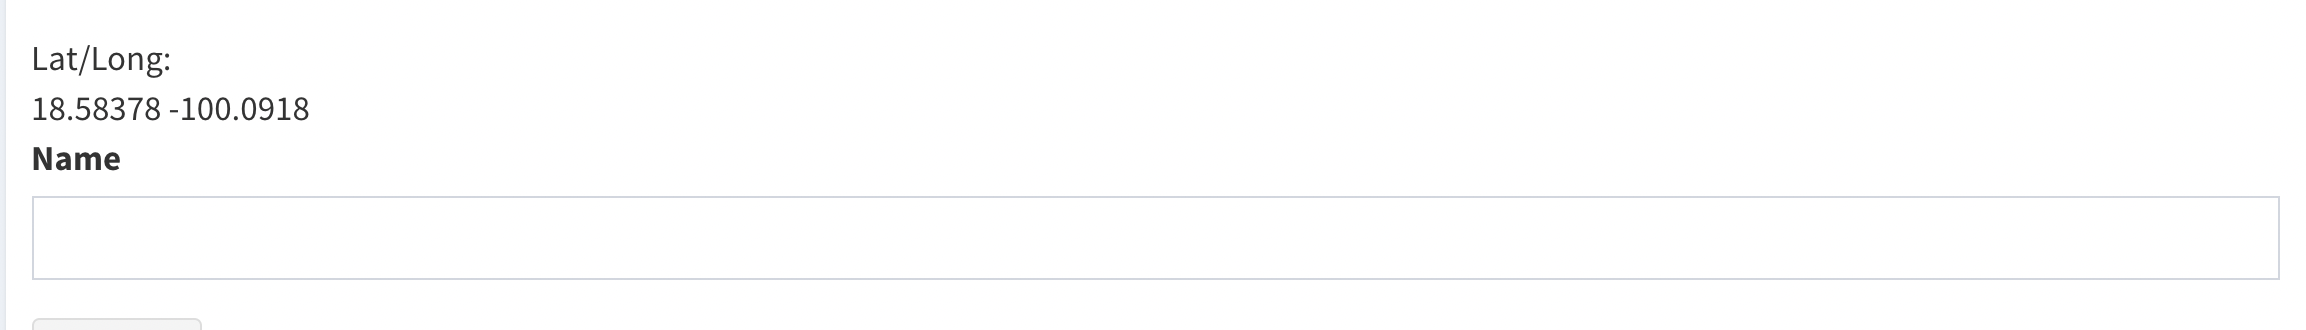
After clicking on the map, the user should see the coordinates:
Now the inputs input$LatIn and input$LonIn
no longer exist in our app, so we will have to replace them with
Loc()[1] and Loc()[2] wherever we had it in
the code. We were using the inputs LatIn and
LonIn to write the information to the google sheet, so we
will change that part of the code and will look like this instead:
# Remember this part is in our server.R under an observeEvent
# Save the data
    data.frame(Name = input$NameIn,
               Lat = Loc()[1],
               Lon = Loc()[2]) %>%
      sheet_append(ss = Geolocations, data = .)
2.3 Rendering UI elements
We can also create dynamic UI elements that will appear under certain
conditions (i.e. when buttons are clicked, or some information is
present). To do this we use the functions: uiOutput() and
renderUI(). In this example we will move the inputs for
sumbiting information to a dynamic UI.
2.3.1 modifying the ui.R
First we will modify our box where the inputs are. We create a new
checkbox input to show/hide this options, and a
uiOutput()
box(title = 'Add New Observation', width = 12,
    checkboxInput(inputId = 'NewEntry', label = 'Add New Observation'), # Option to show/hide UI
    uiOutput(outputId = 'NameOut'), # <---- This is our new dynamic UI
    tableOutput('LocationsDF')
                         )
2.3.2 modifying the server.R
Like any other shiny Output, we have to create it using its
respective function, which in this case will be
renderUI()
# Render the new inputs
output$NameOut <- renderUI({
if(input$NewEntry){ # Only render when the checkbox is active
tagList( # Create a couple of input objects
'Lat/Long:', shiny::textOutput('MapLoc'), # This are the lat/lon coords
shiny::textInput(inputId = 'NameIn', label = 'Name'), # this is the
actionButton(inputId = 'submit', label = 'Submit')
)
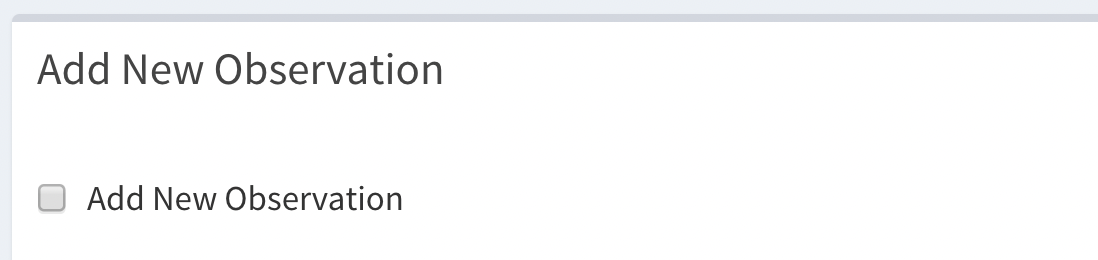
}
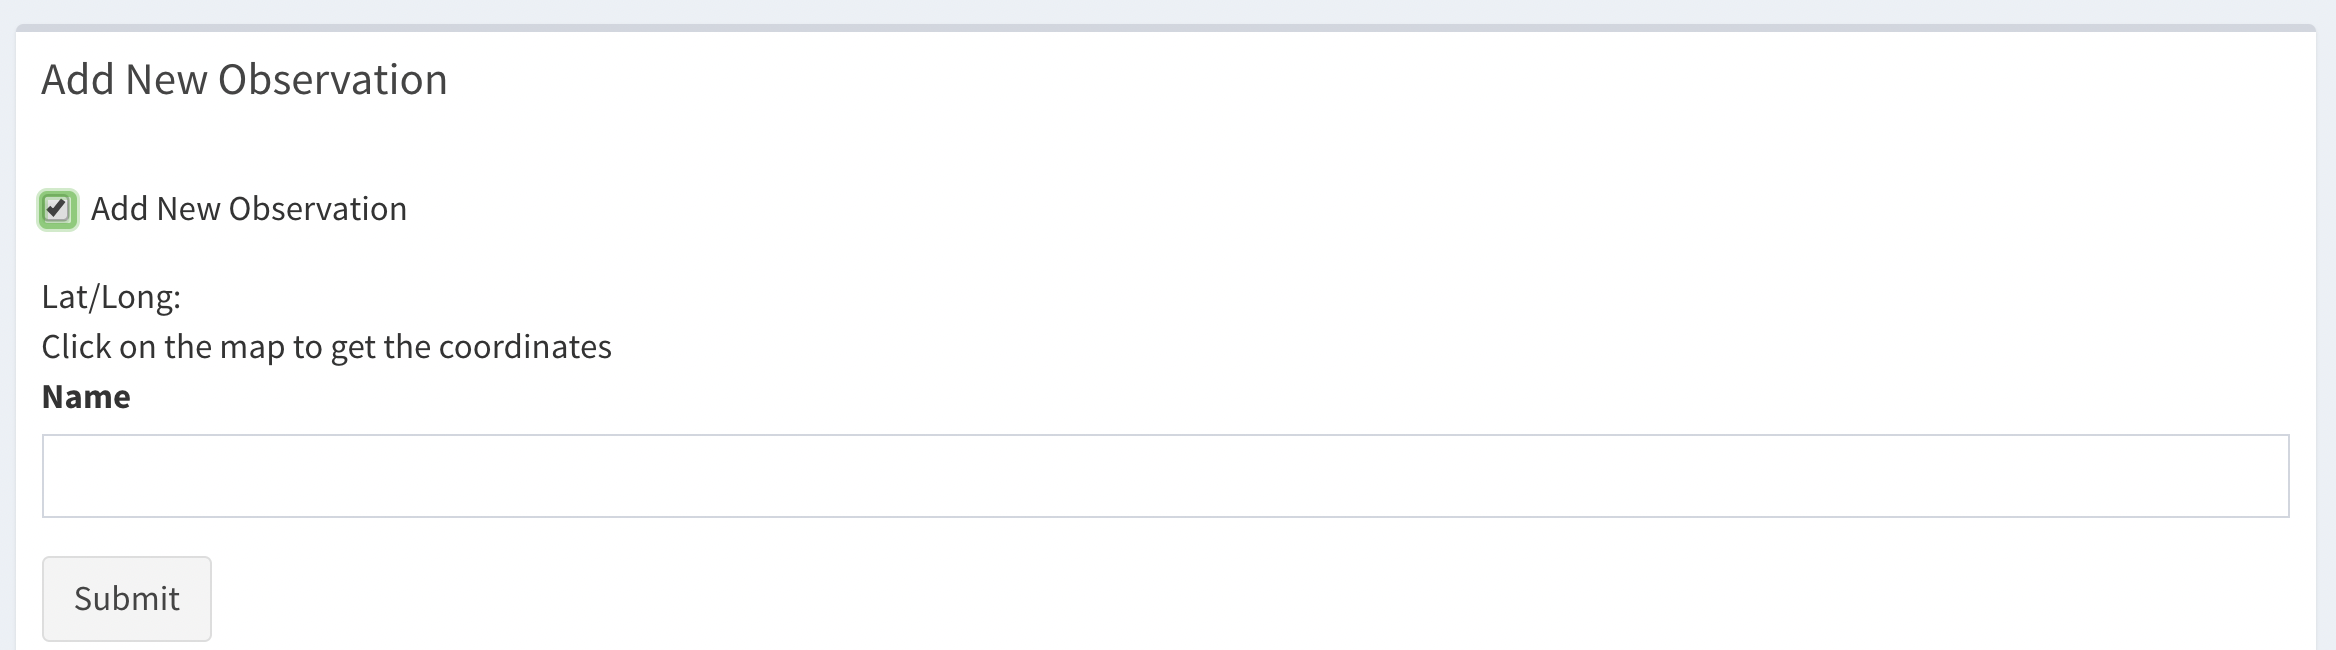
})Now we should see something like this:
And when we check the box, the inputs will appear:
You can download the checkpoint for this lab in this link
3 Few more features of leaflet
To finish this workshop we will just mention a few more features from leaflet that can help with the user experience for our dashboards
# Load libraries
library(dplyr)
library(sf)
library(STNet)
library(leaflet)

# Load data
data("vac") # Data for vaccination
data("vigilancia") # Data for surveillance
data("captura")

# Loading the spatial data from the package
MxShp <- st_read(system.file("data/MxShp.shp", package = "STNet")) %>%
  filter(CVE_ENT %in% c('15', '12', '16')) %>%  # Filter the data to use the states with codes: 15, 12 y 16
  st_transform(crs = st_crs(4326)) # transform to lat/long
## Reading layer `MxShp' from data source
## `/Library/Frameworks/R.framework/Versions/4.2/Resources/library/STNet/data/MxShp.shp'
## using driver `ESRI Shapefile'
## Simple feature collection with 2471 features and 6 fields
## Geometry type: MULTIPOLYGON
## Dimension: XY
## Bounding box: xmin: 1058748 ymin: 319149.1 xmax: 4082958 ymax: 2349605
## Projected CRS: MEXICO_ITRF_2008_LCC# Transform it to spatial points
capturaSp <- captura %>%
st_as_sf(coords = c('LONG', 'LATITUD'), crs = st_crs(4326)) Lets create a base leaflet map and save it in an object:
map <- leaflet() %>%
  addProviderTiles(providers$OpenStreetMap) %>%
  addMarkers(
    data = capturaSp,
    # We can format the popup using some html tags
    popup = ~paste('Name:', NOM_LOC,
                   "<br>Captures:", CAPTURADOS) # The variable we are using for the label
    )
3.1 Measurement
You can add a measurement tool with the function
addMeasure(). This will allow the user to measure distance
between points and areas. You should seee the measurement tool in the
top right corner
map %>%
  addMeasure()
3.2 Inset maps
map %>%
  addMiniMap()
You can also change the base map for the inset mini maps and add other options.
map %>%
  addMiniMap(tiles = providers$OpenTopoMap,
             toggleDisplay = T)
3.3 Adding multiple layers
We can add multiple layers and a menu to change between them, to do this we will first get all the layers from ESRI and then add them to the map with an option to change between layers.
# get all the provider names with ESRI on the text
esri <- grep("^Esri", providers, value = TRUE)

# add all the providers to the map
for (provider in esri) {
  map <- map %>% addProviderTiles(provider, group = provider)
}

# Map the layers with the options to switch between layers
map %>%
  addLayersControl(baseGroups = names(esri),
    options = layersControlOptions(collapsed = FALSE)) %>%
  addMiniMap(tiles = esri[[1]], toggleDisplay = TRUE,
    position = "bottomleft")