Your first App
In this exercise we will create our first shiny app.
Objectives:
- Familiarize with Rstudio and Shiny
- identify basic components of a shiny app
- How to run our app from R
1 Creating your first app
There are multiple ways to create your first app, in general the shiny apps consist of 4 parts:
- Loading the libraries, data and functions.
- User interface (UI).
- Server.
- Integrating the components
shinyApp()
First we will make sure we have the shiny library installed.
# Install shiny
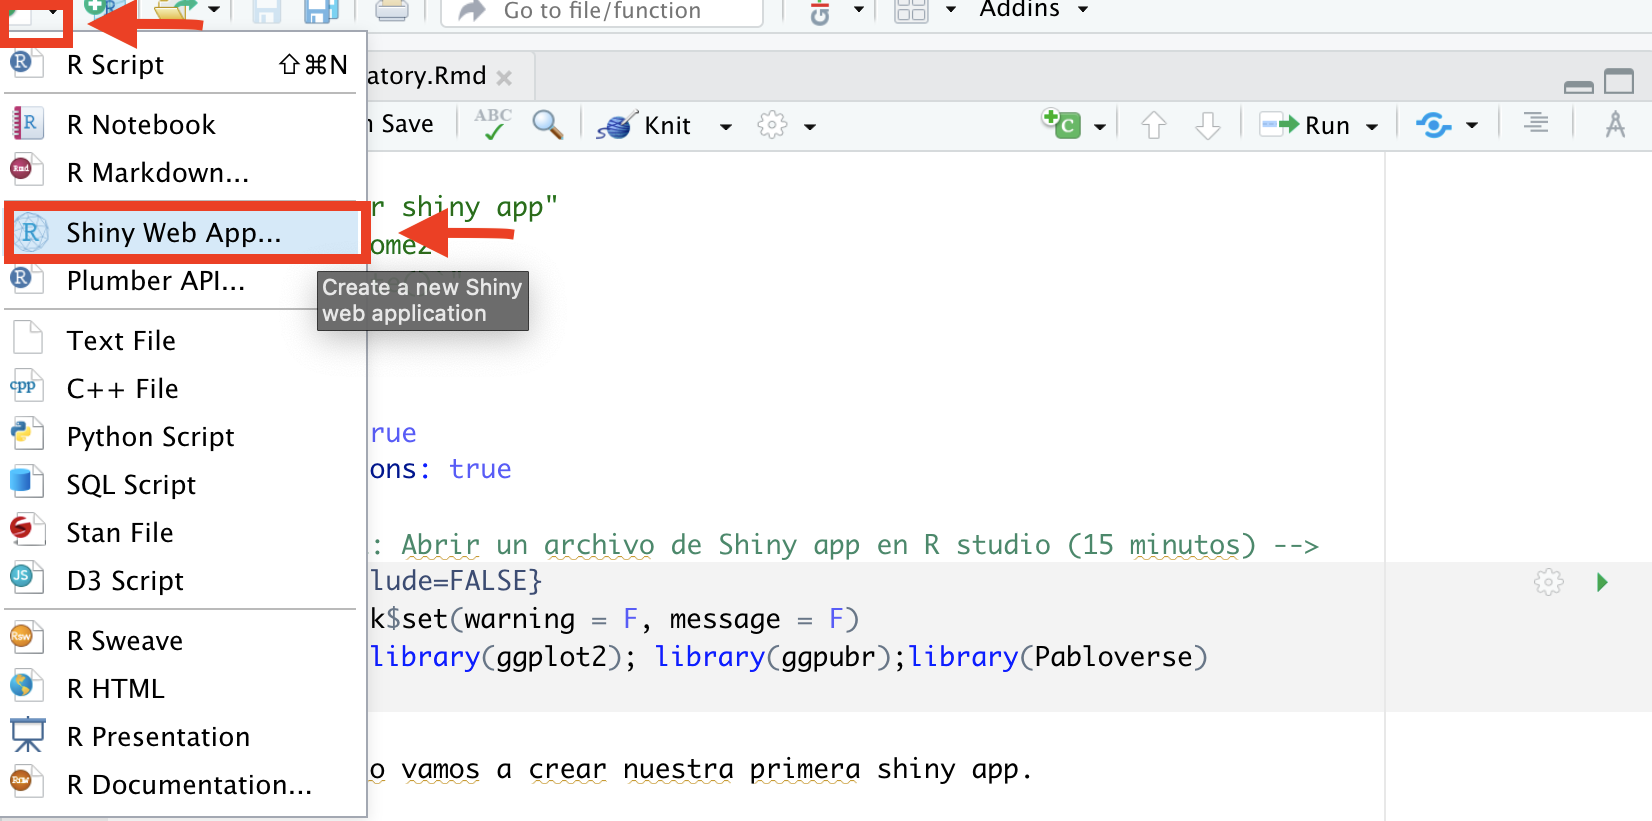
install.packages("shiny")Once we have the library installed, we can start. To create your first web app, lets use the user interface of Rstudio. For this we will go to the menu for creating a new files, and select Shiny Web App… from the list
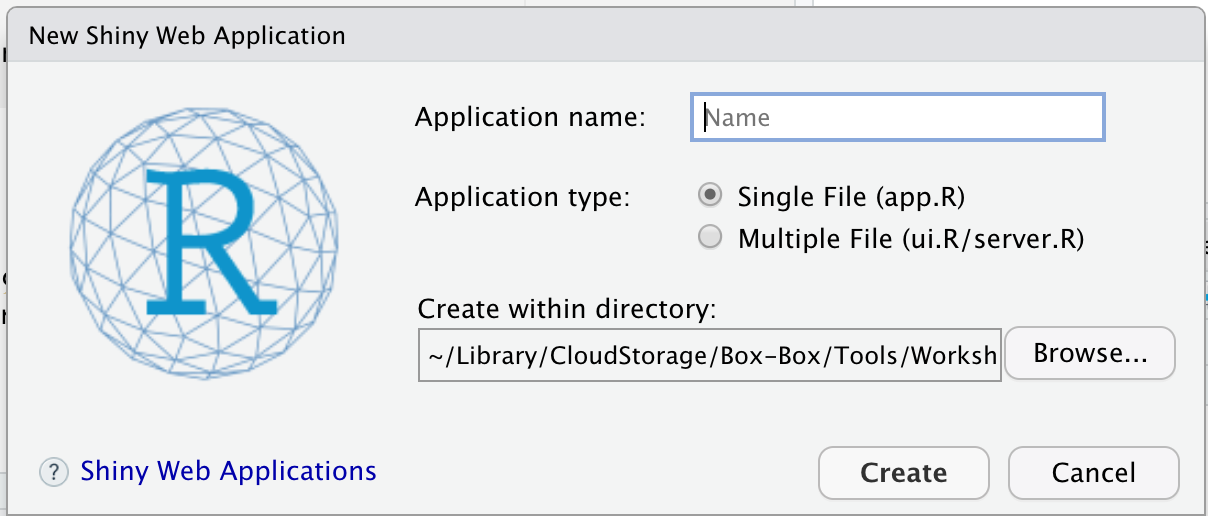
You will see a window with the options to name your app, select if it will be single file or multiple files and the directory where you want to save it.
For now we will select to create a single file, we add the name for the app and save it in a directory from our project.
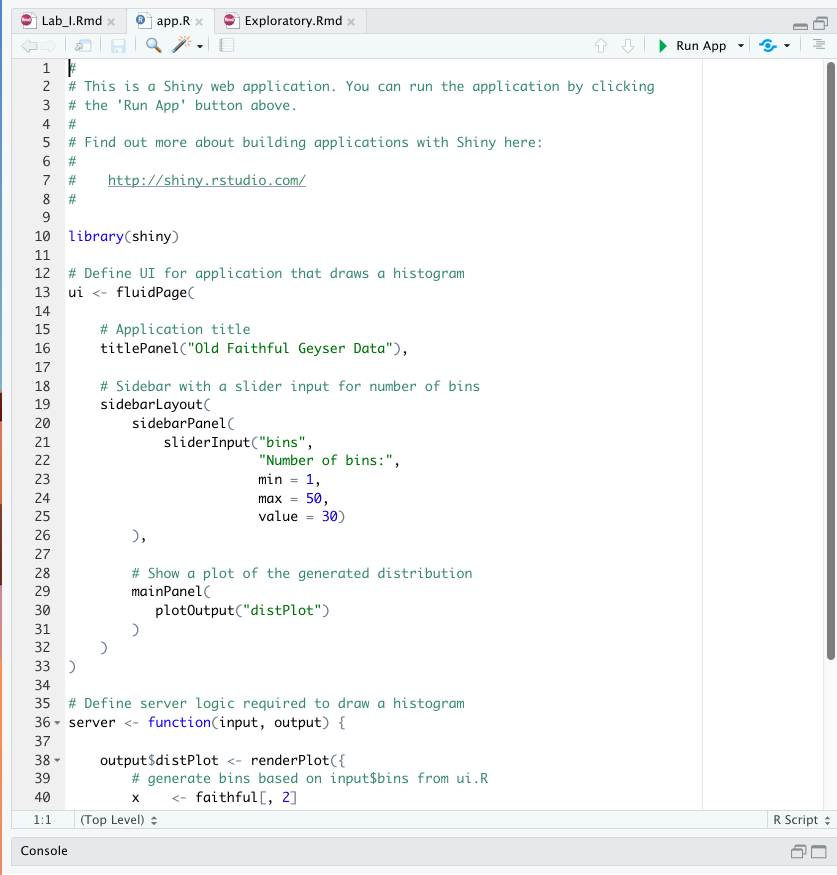
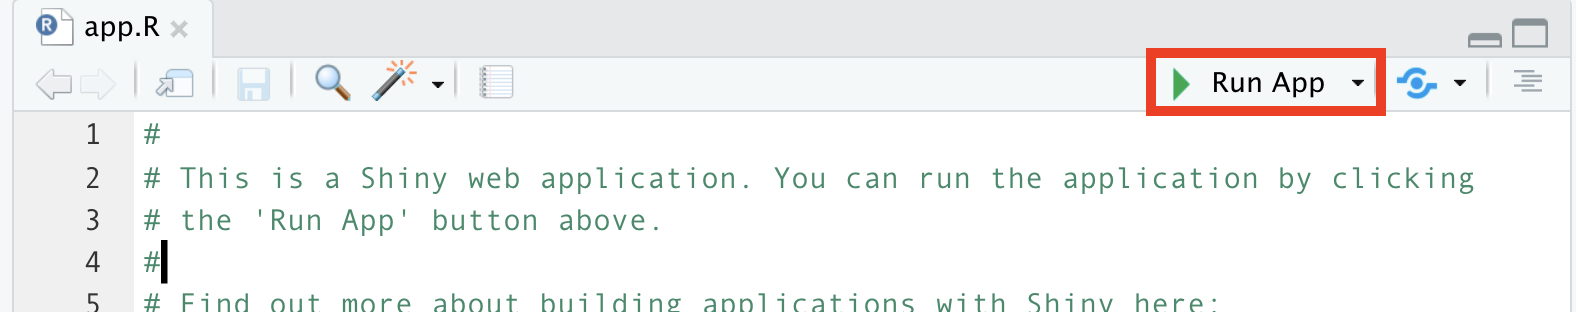
Once you save the app, you will see the file app.R in the source panel. This file contains an example with a generic app you can run.
Identifying the components of the shiny apps can be a bit confusing at first, since there are many functions nested in other functions. It is important to comment as much as possible and leave spaces to make it easier to read the code for your collaborators or your future you. One thing can help with navigating all the parenthesis and nested functions is using the option Rainbow parenthesis, which you can find in the Code menu.
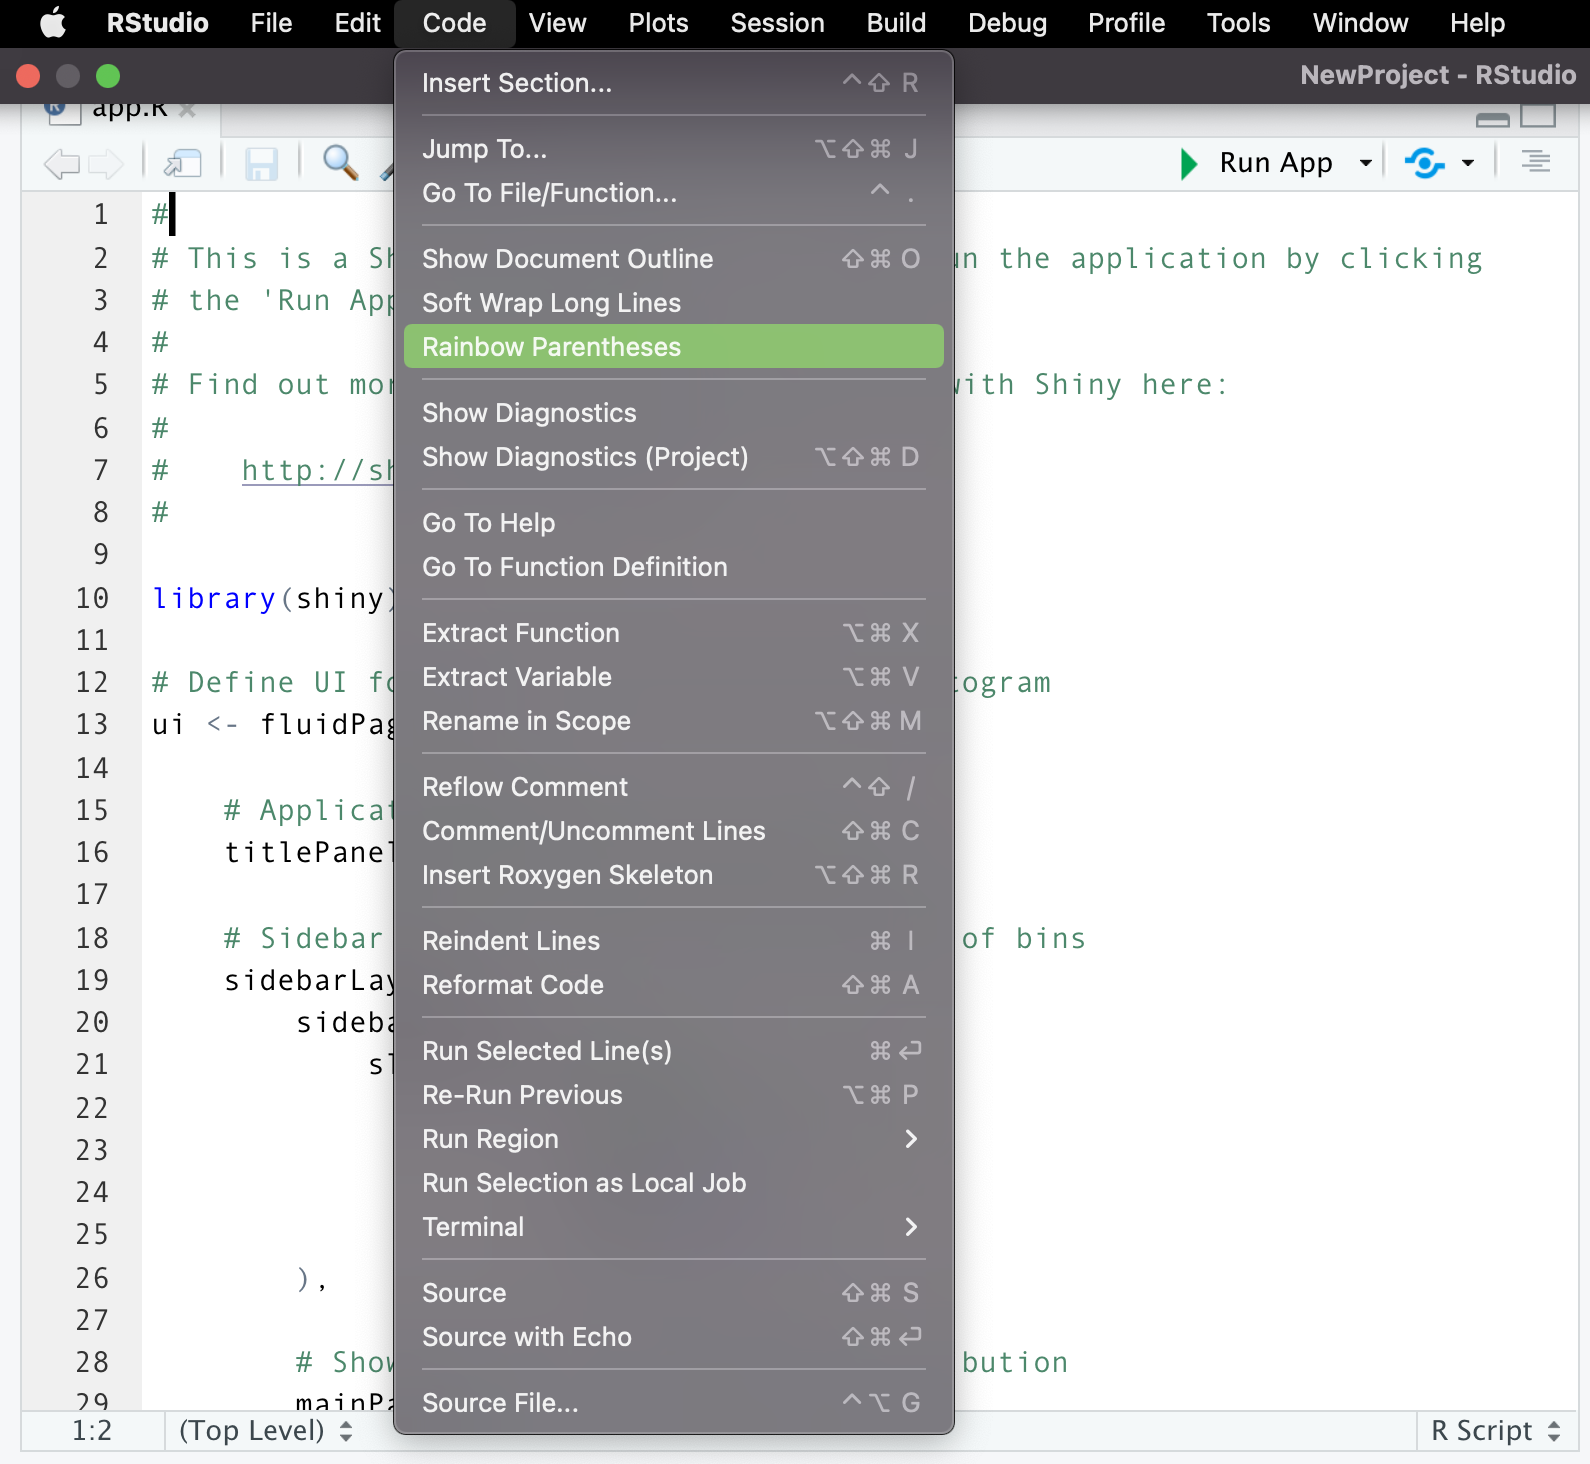
Rainbow parenthesis will color code your parenthesis to help you identify the the start and end of sections.
1.1 Runing the app
To run the shiny app, look for the button Run App in the top right part of your code editor.
While your Shiny app is active, you wont be able to use the R console. To terminate the app, you can close the window and you will automatically go back to Rstudio and see that the console becomes active again.
2 Examining the components
Take some time to go trough the code and examine the app sections, it ok if you see functions and arguments that don’t understand. Try to identify the casic components of the app and make the following changes:
- Change the color of the histogram bars.
- Change the max number of bins to 100.
- Change the title of the plot.